Bitcoin Surges 3.2% Above $100K Amid Geopolitical Tensions

Bitcoin geopolitical tensions

COIN4U IN YOUR SOCIAL FEED

Bitcoin geopolitical tensions: Bitcoin (BTC) demonstrates remarkable resilience, climbing 3.2% in the past 24 hours and maintaining its position above the critical $100,000 psychological level despite weekend selling pressure. This latest surge coincides with escalating geopolitical tensions that are reshaping the cryptocurrency market’s dynamics.

Geopolitical Catalyst Drives Bitcoin Price Action

Recent reports confirm a targeted Iranian attack on Qatar’s Al-Udeid air base, a strategic facility housing U.S. air forces. This aggressive response follows America’s destruction of three major Iranian uranium enrichment facilities and nuclear research centers, marking a significant escalation in Middle East tensions.

The cryptocurrency market reacted swiftly to these developments. Bitcoin’s price accelerated rapidly following initial media reports, with the digital asset now targeting the $103,000 resistance level after finding strong support at $100,000. Trading volumes surged substantially during this price movement, indicating genuine market interest rather than speculative activity.

Massive Short Liquidations Signal Market Sentiment Shift

Massive Short Liquidations Signal Market Sentiment Shift

Professional traders who had positioned themselves short over the weekend faced severe losses as Bitcoin’s unexpected rally caught them off guard. CoinGlass data reveals that $25 million worth of short positions were liquidated within just one hour of the geopolitical news breaking.

The broader cryptocurrency market experienced intense volatility throughout this period. Approximately $220 million was eliminated in both long and short positions over the past 24 hours, demonstrating the extreme leverage present in crypto trading. Weekend liquidations were particularly brutal, with $419 million worth of Bitcoin long positions wiped out during the initial selloff following the U.S. strikes on Iranian facilities.

This dramatic reversal raises a compelling question: Is Bitcoin emerging as the preferred safe-haven asset during times of global uncertainty?

Technical Analysis: Bitcoin Tests $100K Support for Third Time

From a technical perspective, Bitcoin’s current price action presents both opportunities and challenges. The $100,000 level has now served as a crucial support zone three times since May 12, though each subsequent test has resulted in progressively lower highs, suggesting diminishing buyer enthusiasm.

The daily chart reveals concerning signals for Bitcoin bulls. The 9-day and 21-day exponential moving averages (EMAs) have formed a bearish crossover pattern, commonly known as a “death cross.” This technical formation typically precedes significant price declines, though confirmation requires a decisive break below the $100,000 support level.

Despite these bearish indicators, Bitcoin continues trading above its 200-day EMA, which maintains the long-term bullish outlook for the world’s largest cryptocurrency. This key moving average often serves as the dividing line between bull and bear markets in crypto trading.

Bullish Pattern Emerges on Hourly Timeframe

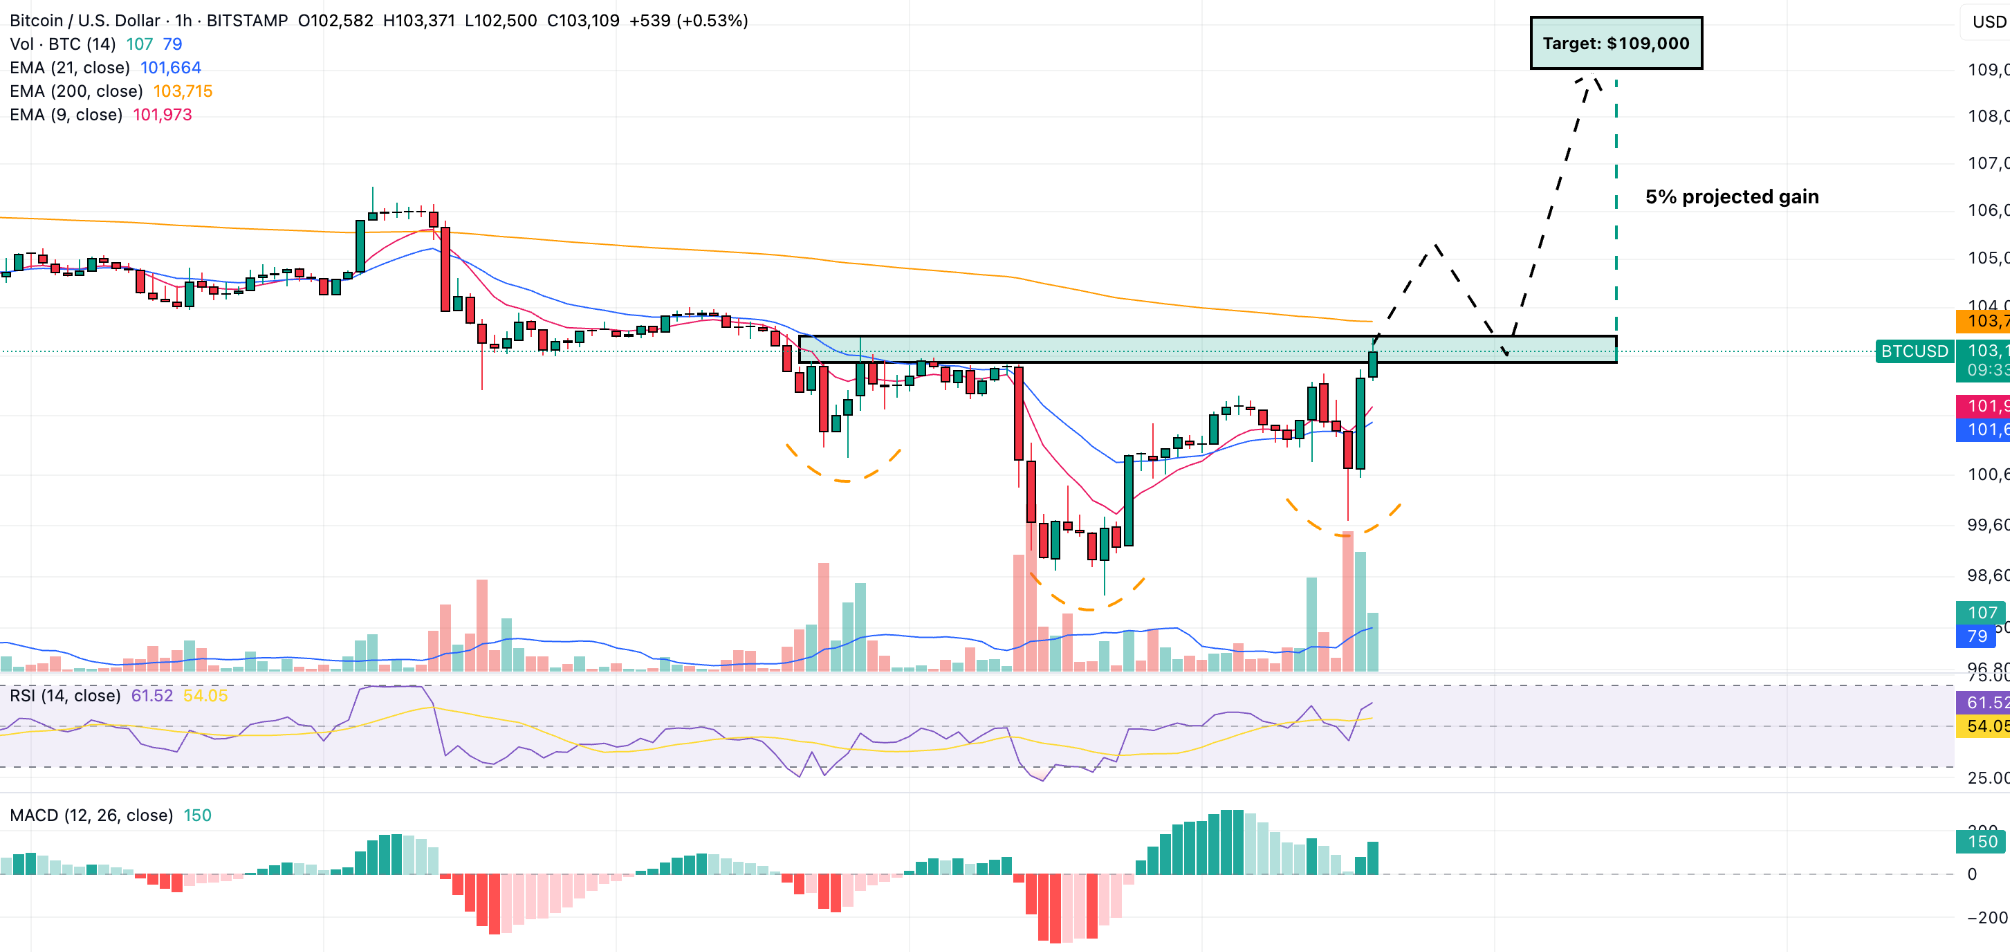
Short-term technical analysis reveals more optimistic signals for Bitcoin traders. The hourly chart displays a potential inverse head and shoulders formation, a classically bullish reversal pattern that could drive significant upward momentum.

The pattern’s neckline resistance sits at $103,443, representing the first significant hurdle for continued price appreciation. Bitcoin found robust support precisely at $100,000, reinforcing the psychological importance of this level to market participants worldwide.

Key price levels to monitor:

  • Immediate resistance: $103,500 (pattern confirmation level)
  • Secondary resistance: $103,443 (neckline retest zone)
  • Bullish target: $109,000 (projected based on pattern measurements)

If Bitcoin successfully breaks above $103,500, traders will receive confirmation that this bullish pattern is valid. The subsequent retest of this level will determine whether buyers can establish sustained momentum toward higher price targets.

Market Implications and Investment Outlook

The convergence of geopolitical uncertainty and technical analysis creates a fascinating backdrop for Bitcoin’s next significant move. Historical precedent suggests that global conflicts often prompt investors to seek alternative assets, with Bitcoin increasingly viewed as “digital gold” during times of crisis.

However, traders must remain cautious given the mixed technical signals present across different timeframes. While short-term patterns suggest potential upside, medium-term indicators warn of possible downside risks if key support levels fail to hold.

Ready to capitalize on Bitcoin’s next significant move? Stay informed about evolving market conditions and geopolitical developments that could impact cryptocurrency prices. Consider implementing proper risk management strategies and avoiding excessive leverage during these volatile periods.

The coming days will prove crucial for Bitcoin’s direction as both technical and fundamental factors align to create significant trading opportunities for prepared investors.

Explore more articles like this

Subscribe to the Finance Redefined newsletter

A weekly toolkit that breaks down the latest DeFi developments, offers sharp analysis, and uncovers new financial opportunities to help you make smart decisions with confidence. Delivered every Friday

By subscribing, you agree to our Terms of Services and Privacy Policy

Picture of Ali Malik

Ali Malik

Ali Malik is an experienced crypto writer specialising in simplifying complex blockchain and cryptocurrency topics for a broad audience. With expertise in ICOs, Web3, DeFi, NFTs, and regulatory updates, he offers valuable insights to help readers make informed decisions. He is proficient in SEO optimisation.

READ MORE

Ethereum Price Surge Can It Sustain Momentum Above $1,800?

Ethereum Price Surge

COIN4U IN YOUR SOCIAL FEED

The second-largest Cryptocurrency Market capitalisation, Ethereum (ETH), is reaching a turning point in price activity. ETH has now soared above the $1,800 level, moving towards a perhaps significant horizontal rebound not seen in months after months of consolidation and downward pressure. As Ethereum approaches a critical resistance level, traders, analysts, and market players all pay more focused attention.

Often seen as a yardstick of investor mood, Ethereum’s price behaviour is a significant predictor of the state of the larger cryptocurrencies. ETH has been stuck in a range over the past few weeks, oscillating between key support and resistance levels. But with a recent surge over $1,800, Bitcoin has spurred fresh debates on whether bulls can keep their momentum or if the market will go down once more.

Ethereum Price Surge

Ethereum is trading at about $1,806 at the time of writing, a good 1.85% rise in daily value. With a peak intraday price of $1,820.32, the bitcoin indicates a temporary drive to cross a set resistance zone. This is a clear departure from the steady range-bound trading ETH had seen over the last few months; many are now wondering whether this recent surge heralds the start of a more prolonged upward trend.

Ethereum Price Surge

ETH rose beyond $1,800 following months of stabilisation in the $1,600 to $1,700 range as it struggled to find a direction in this market uncertainty. The current jump suggests Ethereum aficionados may be ready to intervene and force the price higher, but the question is whether they can hold the line or if this is just another ephemeral increase.

Ethereum Price Levels Analysis

Ethereum’s recent surge has taken it above the critical $1,800 resistance level, which had previously acted as a cap for ETH’s price action for several months. The $1,800 level is now being watched closely by traders to see whether the price can maintain this newfound strength or if it will fall back below this threshold. A sustained move above $1,800 would open the door for Ethereum to challenge higher levels.

Immediate resistance lies at $1,850, and if ETH can break through this level, it could potentially retest $1,900. Should Ethereum reach and hold above this area, it would indicate a robust shift in market sentiment, increasing the probability of revisiting the highs seen earlier in 2023 and possibly pushing towards a new all-time high near $2,000. For now, these are the key levels to watch in the coming days and weeks.

On the flip side, there are several support levels that traders will be monitoring closely. The immediate support lies at the $1,750 mark. If the price falls below this level, it could signal a potential retracement to the $1,700 region. Below that, the next major support level would be around $1,650, which would signal deeper weakness in the market. As long as ETH can hold above $1,700, the bullish case remains intact.

Ethereum Bullish Momentum

Ethereum’s 20-day exponential moving average (EMA), which has recently shown support, is a key signal. ETH continues above this crucial moving average, indicating a short-term uptrend. Though the relative strength indicator (RSI) is overbought, the surge may be consolidating. An RSI near to 70 indicates a market overstretched; Ethereum may pull back if buying demand drops.

If the market is favourable, ETH can rise as long as the RSI is below 70. Bulls are optimistic, but traders and investors should watch for signs of fatigue or market reversal.

Ethereum Price and Momentum

Ethereum’s recent price fluctuation is influenced by both technical factors and Bitcoin market sentiment. As ETH breaks $1,800, traders are showing hope after a long period of low activity. Institutional investors are increasingly considering Ethereum as a Bitcoin alternative, especially as Ethereum 2.0 approaches. Ethereum 2.0’s claimed scalability, lower transaction costs, and more sustainable proof-of-stake consensus process may boost long-term ETH demand.

Ethereum Price and Momentum

Particularly with the growing number of Ethereum-based financial products, reports indicate that institutional curiosity in ETH is rising. Should this pattern continue, it could bring Ethereum’s price more upward pressure, therefore sustaining any optimistic momentum.

Final thoughts

For Ethereum, this last effort to recover the $1,800 resistance level is a momentous event and tests if bulls can keep the momentum. Technical indicators point to a bullish phase of the market, although as ETH reaches overbought levels, there are indications of possible consolidation. The next few days will be crucial in deciding whether a downturn is approaching or whether Ethereum can sustain its gains and go towards more price levels. The main point of observation for short-term investors should be the $1,800 level.

Explore more articles like this

Subscribe to the Finance Redefined newsletter

A weekly toolkit that breaks down the latest DeFi developments, offers sharp analysis, and uncovers new financial opportunities to help you make smart decisions with confidence. Delivered every Friday

By subscribing, you agree to our Terms of Services and Privacy Policy

READ MORE

ADD PLACEHOLDER