

XRP has traders leaning in. After pushing up to a $1.65 peak, XRP reversed and dropped below $1.50, sparking fresh debate around near-term direction, market structure, and what the next “decision zone” might look like. For anyone tracking an XRP price prediction, this is a classic inflection moment: a sharp rise that meets resistance, a fast pullback that tests support, and a market that’s still trying to decide whether the broader trend remains constructive or if a deeper retracement is setting up.
Price action like this tends to attract two very different audiences. Short-term participants see volatility as opportunity, hunting for bounce setups, breakdown confirmations, and liquidity sweeps. Longer-term holders, meanwhile, often look past the noise and focus on whether XRP is still building a foundation for the next leg higher. Both groups, however, care about the same basics: where support is likely to hold, where sellers may step in again, and what catalysts—on-chain, macro, or ecosystem-related—could shift sentiment.
In this article, we’ll build a grounded XRP price prediction using common technical and behavioral market tools: support and resistance mapping, trend context, momentum, and sentiment. We’ll also discuss broader crypto market drivers that can influence XRP’s next move, such as liquidity conditions, Bitcoin’s direction, and narrative rotation. You’ll come away with a practical framework for interpreting this dip below $1.50, what to watch next, and how to think about upside and downside scenarios without getting trapped by hype or fear.
The Snapshot: XRP Slips Under $1.50 After $1.65 Rejection
A rise to $1.65 followed by a drop below $1.50 often signals that the market found a near-term ceiling, at least temporarily. In many cases, a peak like $1.65 becomes a psychological marker—an area where earlier buyers take profit and where sellers test their conviction. When price fails to hold near the top, it can trigger a chain reaction: late entrants cut risk, leveraged positions unwind, and the market hunts for a lower support region where demand is more reliable.
From an XRP price prediction standpoint, what matters most isn’t that XRP dipped under $1.50 by itself. It’s how price behaves after doing so. Markets frequently “probe” below key levels to test whether buyers will defend them. If the drop below $1.50 is brief and followed by a steady reclaim, traders often interpret it as a liquidity sweep rather than a true breakdown. If price stays below $1.50 and repeatedly fails to regain it, the level can flip from support to resistance, increasing the odds of a deeper retracement.
The other critical detail is the context of the move. Did XRP climb toward $1.65 in a broad market rally with strong risk appetite, or did it move independently? When the wider market is strong, pullbacks are sometimes just resets. When the wider market is shaky, the same pullback can become the beginning of a larger correction. That’s why an effective XRP price prediction combines XRP-specific levels with broader crypto sentiment.
Key Technical Levels Driving the XRP Price Prediction
The $1.50 Level: Psychological Support and Market Memory
Round numbers tend to matter in crypto, and $1.50 is a prime example. It’s easy to remember, easy to anchor decisions around, and commonly used for stop placement and limit orders. When XRP drops below $1.50, it often triggers emotional responses—fear from recent buyers and curiosity from dip hunters. In practice, this makes $1.50 a high-liquidity zone where price can whip around before choosing direction.
For this XRP price prediction, think of $1.50 as the “line in the sand” for short-term structure. If XRP can reclaim $1.50 and hold it on repeated tests, it suggests demand is still present and that the pullback may be corrective rather than trend-ending. If XRP keeps closing below $1.50 and struggles to reclaim it, then sellers are likely controlling the near-term tape, and downside targets become more relevant.
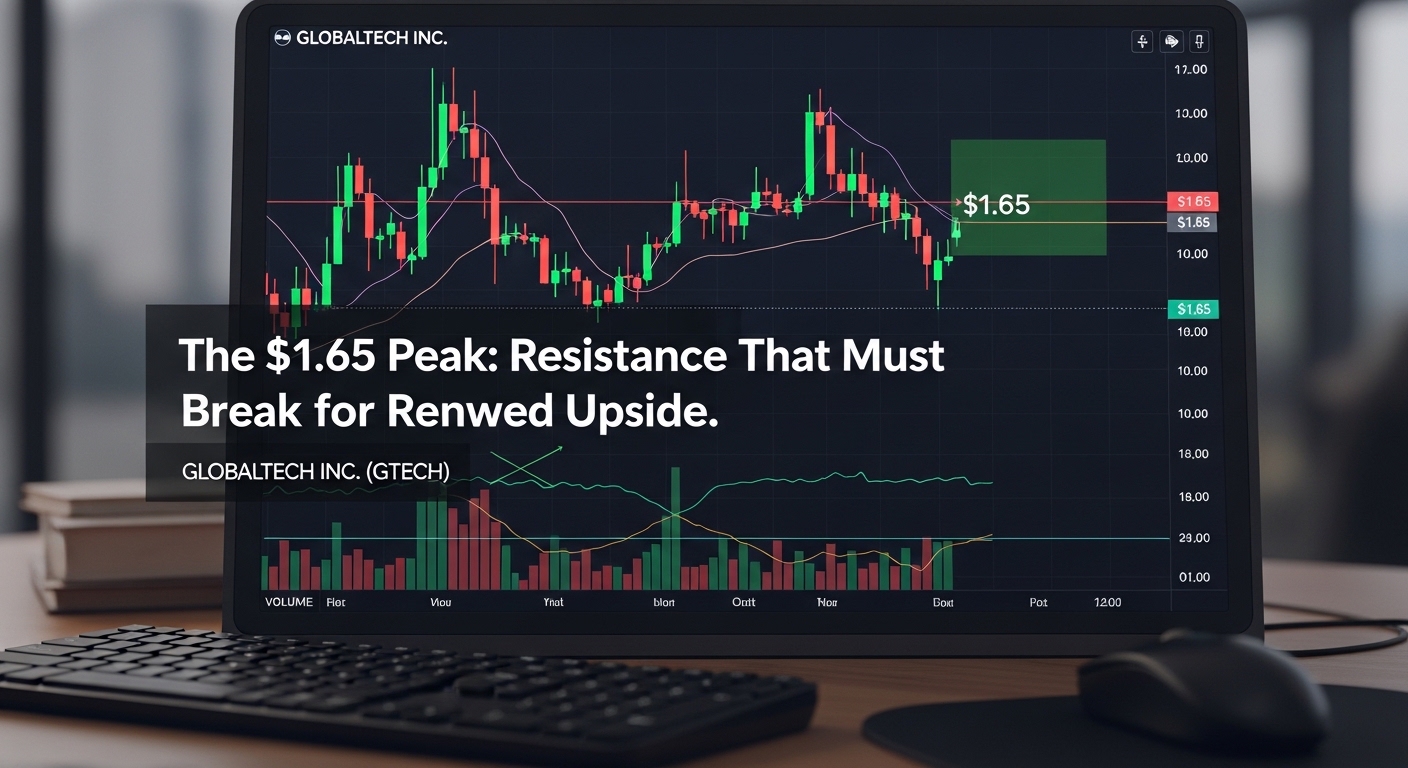
The $1.65 Peak: Resistance That Must Break for Renewed Upside
The $1.65 area is now the obvious resistance reference point. Once a market rejects from a level like that, it often takes time—and multiple attempts—to break through. Traders begin treating it as a selling zone until price proves otherwise. That means rallies back toward $1.65 can face supply from participants who missed the first exit or who believe the market is overextended.
In an XRP price prediction model, $1.65 is less about a single price and more about what it represents: a region where momentum stalled. If XRP later reclaims $1.65 with strong follow-through, it can unlock a higher range and shift sentiment from “sell the rip” to “buy the dip.” Conversely, repeated failures at $1.65 tend to compress price into a choppy range, where traders focus on short-term mean reversion rather than directional bets.
Intermediate Support Zones: Where Buyers May Step In
Between major markers like $1.50 and $1.65, the market typically respects intermediate zones that acted as pivots during the run-up. These are areas where price paused, consolidated, or reversed intraday. If XRP continues to drift lower after slipping under $1.50, traders will look for a well-defined support region where bids previously appeared.
For readability and relevance, the key takeaway is simple: strong uptrends often pull back to prior demand zones before resuming higher. A solid XRP price prediction accounts for these potential “base” areas where the market can rebuild momentum. If XRP finds stability and starts printing higher lows, the probability of retesting $1.50 and pushing toward $1.65 increases.
Momentum and Market Structure: Is This a Healthy Pullback or Trend Shift?
Reading the Trend: Higher Highs, Higher Lows, or Distribution?
A clean way to frame this XRP price prediction is to ask whether XRP is still forming higher highs and higher lows on the time frame that matters to you. If XRP’s broader structure still shows higher swing lows despite the drop below $1.50, then the move may be a typical retracement within an uptrend. If the drop breaks key swing lows and turns rebounds into lower highs, it becomes more consistent with a short-term downtrend or distribution phase.
Crypto markets can also “distribute” after a peak. Distribution is when price churns in a range while stronger hands sell into demand. It doesn’t always look dramatic at first; it often starts with a peak like $1.65, then a sharp drop, then a series of frustrating rallies that fail to break the prior high. Watching how XRP behaves around reclaimed levels—especially $1.50—helps distinguish a normal reset from a developing topping pattern.
Volatility and Liquidity: Why XRP Can Move Fast
XRP has a reputation for sudden bursts of movement. Liquidity conditions, leverage in derivatives markets, and concentrated positioning can cause abrupt spikes and equally abrupt pullbacks. When XRP breaks below a key level, stop-loss clusters can accelerate the move. When XRP reclaims a level, short covering can fuel a quick pop. This back-and-forth is exactly why many traders prefer to wait for confirmation rather than trying to guess the precise bottom.
For this XRP price prediction, it’s useful to view volatility as information. A sharp drop below $1.50 followed by an equally sharp recovery suggests aggressive two-way participation. A slow bleed below $1.50 suggests demand is weaker and buyers are hesitant. The texture of the move matters, not just the number.
Catalysts That Can Influence XRP Next Move
Broader Crypto Market Direction and Risk Appetite
Even when XRP has its own narrative, it rarely trades in isolation. Bitcoin’s trend, overall market liquidity, and risk-on or risk-off sentiment can influence whether XRP bounces or continues lower. If the broader market is bullish and capital rotates into large-cap altcoins, XRP may benefit from renewed inflows. If the broader market turns defensive, rallies can get sold more quickly.
In practical terms, an XRP price prediction should remain flexible. Strong market-wide conditions make it easier for XRP to reclaim $1.50 and challenge $1.65 again. Weak market conditions make it harder, increasing the chance that $1.50 becomes resistance and that XRP spends more time rebuilding.
XRP Ecosystem Developments and Narrative Rotation
Crypto is also driven by narratives—payments, tokenization, real-world assets, cross-border settlement, and institutional adoption themes can all influence attention. When a narrative catches, price sometimes moves ahead of fundamentals, and then pulls back when excitement cools. The move from $1.65 down through $1.50 could reflect exactly that: a burst of enthusiasm followed by a sentiment reset.
To keep this XRP price prediction grounded, focus less on headlines alone and more on how the market reacts to them. Bullish news that fails to push price higher can be a warning sign. Neutral news that price shrugs off while holding support can be quietly bullish.
XRP Price Prediction Scenarios: What to Expect Next
Bullish Scenario: Reclaim $1.50, Build a Base, Retest $1.65
In the bullish case, XRP’s dip below $1.50 is brief. Price reclaims $1.50 and begins to hold it on pullbacks, turning it back into support. This would likely be accompanied by improving momentum and a healthier market tone overall. Once XRP establishes $1.50 as a defended area again, the next natural target becomes a retest of the $1.65 peak.
A bullish XRP price prediction doesn’t assume a straight line up. It expects consolidation, retests, and volatility. But it does suggest that as long as buyers keep defending the key psychological level, the odds of eventually challenging resistance increase. If XRP breaks above $1.65 with conviction, sentiment can shift rapidly, and a new range may form above that level.
Neutral Scenario: Range Trading Between $1.50 and $1.65
The market often chooses boredom after excitement. In a neutral case, XRP chops between $1.50 and $1.65, repeatedly failing to break either direction. This is common after a sharp move and rejection. Traders fade extremes, liquidity builds, and the next breakout attempt becomes more meaningful because positioning is more balanced.
For a neutral XRP price prediction, the best approach is usually patience. Range conditions reward discipline: buying support when it holds, selling resistance when it rejects, and staying alert for false breakouts. The longer the range persists, the more explosive the eventual resolution can become.
Bearish Scenario: $1.50 Turns Into Resistance and XRP Slides Further
In the bearish case, XRP cannot reclaim $1.50, or it reclaims it briefly but fails to hold it. That “failed reclaim” pattern is a common sign that sellers are using bounces to exit or to add pressure. When a former support becomes resistance, the market often seeks a lower level where buyers are more willing to step in.

A bearish XRP price prediction focuses on risk management and confirmation. If XRP continues to print lower highs and lower lows, the path of least resistance stays down until proven otherwise. Importantly, bearish does not mean “doom forever.” It means the market is in a corrective or downtrend phase that requires new demand to reassert control. Watching for stabilization, reduced selling pressure, and improved structure can signal when the bearish phase is ending.
How Traders and Investors Can Think About This Setup
Short-Term Traders: Confirmation Over Guessing
Short-term participants often look for clear signals: reclaiming $1.50, holding it, and building higher lows for long setups; or failing to reclaim and printing lower highs for short setups. Because XRP can move quickly, traders frequently benefit from letting the market show its hand. For this XRP price prediction, the most useful mindset is “react, don’t predict.” Let levels and structure guide decisions instead of trying to nail the exact bottom or top.
Long-Term Holders: Trend Context and Fundamentals Matter More
Longer-term holders may care less about whether XRP is at $1.49 or $1.52 and more about broader adoption trends and multi-month structure. Still, these levels matter because strong trends often build from clear technical foundations. A long-term oriented XRP price prediction can remain constructive while acknowledging that pullbacks are normal—and sometimes necessary—to sustain a healthier market.
Conclusion: XRP Price Prediction After the Drop Below $1.50
The move is clear: XRP hit a $1.65 peak and then dropped below $1.50, creating a fresh battleground for bulls and bears. From an XRP price prediction perspective, $1.50 is the key short-term pivot. A reclaim and hold can set the stage for a renewed push toward $1.65, while repeated failures to regain $1.50 increase the odds of a deeper retracement and a longer consolidation phase.
The most practical approach is to watch how XRP behaves around these levels rather than relying on absolute certainty. Markets rarely move in straight lines, and XRP is known for volatility. Whether you trade actively or invest for the long haul, the next chapters will likely be written by how convincingly XRP can reclaim lost ground—or how firmly sellers can defend it. Either way, the structure is now well-defined, and that clarity is exactly what traders and investors need to form a smart plan.
FAQs
Q: Why did XRP drop below $1.50 after reaching $1.65?
After a strong push to $1.65, profit-taking and seller pressure often increase near a visible resistance area. When momentum fades, late buyers can exit quickly, pushing XRP below $1.50 and triggering additional selling through stop losses.
Q: Is dropping below $1.50 bearish for XRP?
It can be, but it depends on follow-through. If XRP quickly reclaims $1.50 and holds it, the drop may be a temporary liquidity sweep. If XRP stays below $1.50 and fails to reclaim it, the level can turn into resistance, which is more bearish.
Q: What level matters most for an XRP price prediction right now?
In the near term, $1.50 is the most important pivot because it’s psychological and widely watched. On the upside, $1.65 is the key resistance level that must break to confirm renewed strength.
Q: Can XRP retest $1.65 soon?
Yes, if XRP stabilizes and reclaims $1.50 with improving momentum and supportive broader market conditions. A steady base above $1.50 often increases the probability of a retest of prior highs.
Q: What should I watch to confirm the next XRP trend?
Watch whether XRP forms higher lows after reclaiming $1.50, and whether rallies show stronger follow-through toward $1.65. If rebounds repeatedly fail and price prints lower highs, the market may still be in a corrective phase.