

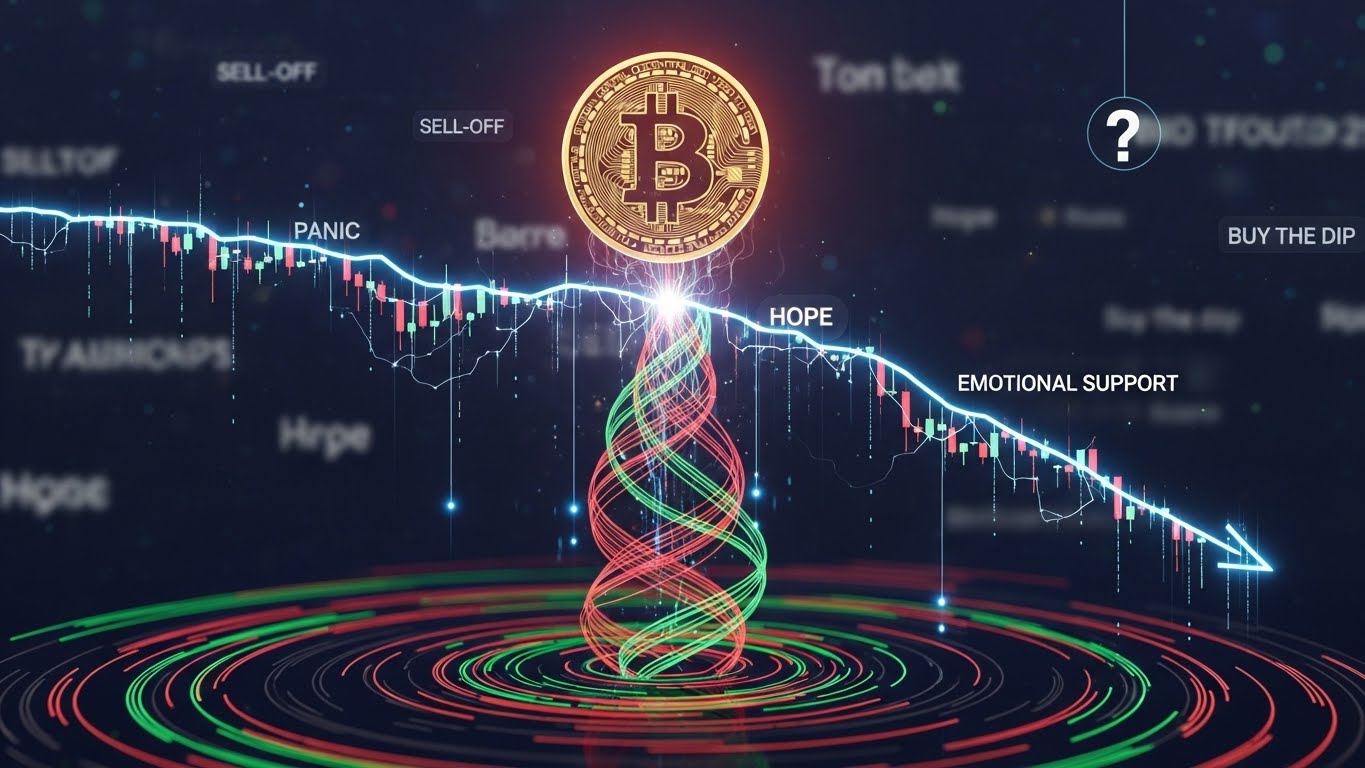
Bitcoin has always been more than just a chart, a ticker, or a market cap number. It’s a global financial experiment powered as much by psychology as it is by code. That’s why the phrase Bitcoin tests critical emotional support levels resonates so strongly with traders, long-term holders, and even casual observers. These levels are not only technical zones where price historically reacts—they are emotional pressure points where fear, hope, uncertainty, and conviction collide. When Bitcoin drifts into these areas, markets often behave like crowds: reactive, impatient, and sometimes irrational.
In traditional markets, support and resistance represent collective behavior. In Bitcoin, that behavior is amplified. Bitcoin trades 24/7, responds instantly to macro headlines, and is driven by a mix of retail investors, whales, miners, and institutional players. Each group brings different motives and time horizons—but they often react to the same key levels. This is why Bitcoin emotional support levels can become self-fulfilling: if enough people believe a level matters, their actions make it matter.
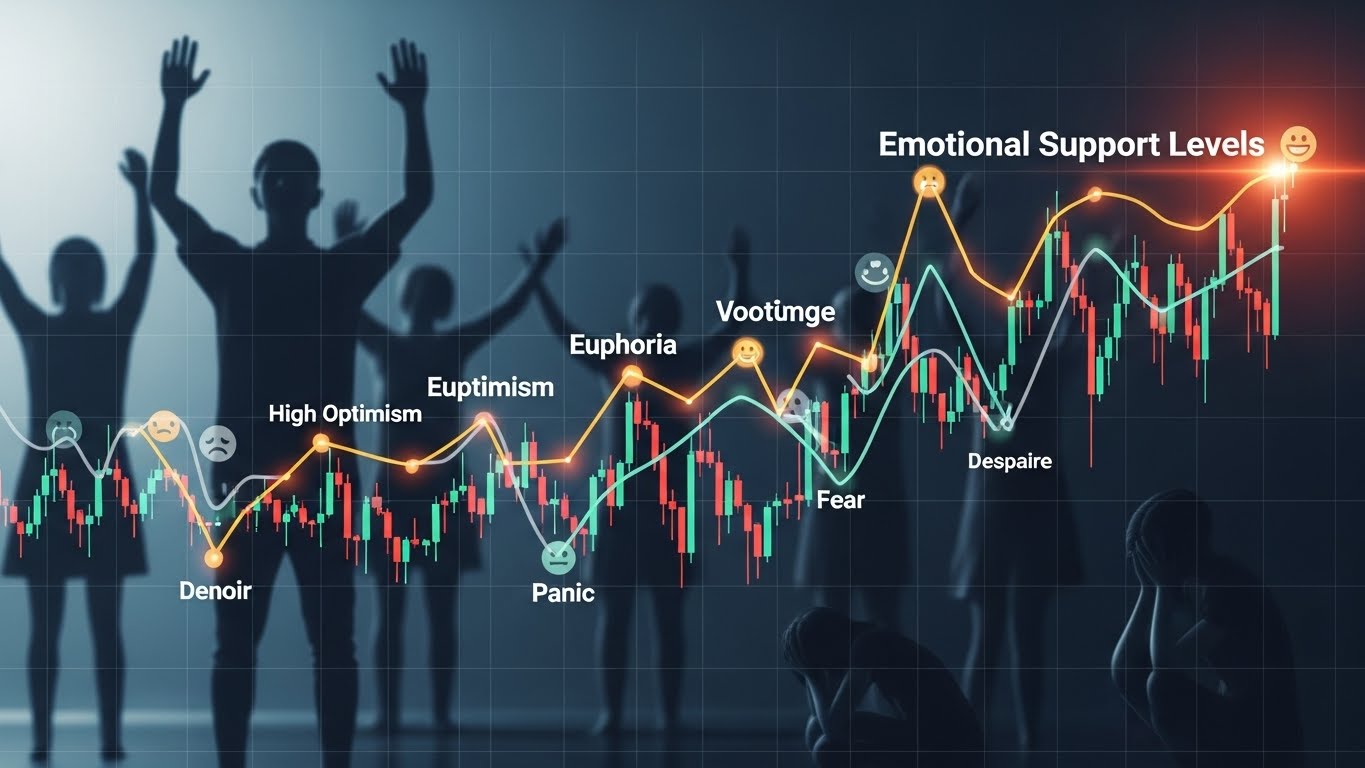
The idea of “emotional support” in price action points to something deeper than Fibonacci lines or moving averages. It describes zones where a large number of participants become emotionally attached. Some bought there and don’t want to be wrong. Others missed the move and want another chance. Some believe it’s “cheap,” while others fear it could collapse if that level breaks. When Bitcoin tests these zones, you can almost feel sentiment shifting—from calm to cautious, cautious to panic, or panic to sudden relief.
This article explores what it really means when Bitcoin tests critical emotional support levels, why these zones form, and how traders can interpret them using technical analysis, on-chain data, market sentiment indicators, and macro context. You’ll also learn how these levels affect volatility, liquidity, and momentum—and what potential scenarios could unfold next. By the end, you’ll have a clearer framework for understanding the psychological mechanics behind Bitcoin price action, without getting lost in hype or fear.
What Are Emotional Support Levels in Bitcoin?
When people say Bitcoin tests critical emotional support levels, they’re usually describing price zones that act like psychological safety nets. These are areas where buyers historically step in with conviction because they believe Bitcoin is undervalued, or because they fear missing a rebound. But emotional support levels aren’t always clean lines. They often form “bands” where price may wick below temporarily, only to reclaim the zone quickly.
Emotional support is where a market’s belief system is challenged. When Bitcoin approaches one of these levels, traders begin to ask the same questions: “Will it hold?” “Is this a breakdown?” “Is this a dip-buying opportunity?” These questions create waves of decisions—some buy, some sell, some hedge, and others panic close positions. That collective reaction is why Bitcoin can produce dramatic bounces from support, or brutal cascades when support fails.
A key feature of Bitcoin is that support levels don’t exist only on charts. They also exist in the minds of investors. Round numbers, past all-time highs, and widely watched moving averages can become emotionally significant. When Bitcoin revisits those levels, it’s not just price action—it’s a memory test. Markets remember pain and profit.
The Psychology Behind Support Zones
Support zones form because humans behave predictably under uncertainty. When Bitcoin falls, fear increases. But fear often peaks near levels where people expect a rebound. Traders who previously profited from buying similar dips remember the reward and repeat the behavior. Meanwhile, sellers who panic early may hesitate at support, thinking they’re “too late” to sell. This creates a temporary equilibrium where selling pressure slows and buying pressure rises.
That’s why Bitcoin tests critical emotional support levels often coincide with emotional extremes. When sentiment is highly bearish and price hits a major support, even a small push upward can trigger relief rallies. Conversely, when sentiment is fragile and support breaks, it can create a domino effect of forced selling, liquidations, and “capitulation” behavior.
Emotional Support vs Technical Support
Technical support is often defined by chart structure: swing lows, consolidation ranges, trendlines, and indicators. Emotional support overlaps with technical support but adds a behavioral layer. Emotional support levels are where traders become anchored—their decisions are heavily influenced by previous price action and expectations, not necessarily new information.
For example, a level might be technical support because it held multiple times before. But it becomes emotional support because thousands of traders now watch it, discuss it, and place orders around it. The level gains weight because it gains attention.
Why Bitcoin Tests Critical Emotional Support Levels So Often
Bitcoin is volatile by nature, and volatility creates repeated tests of key levels. A market that moves fast revisits zones frequently, especially during periods of uncertainty. When Bitcoin tests critical emotional support levels, it’s often because the market is transitioning between phases: accumulation, expansion, distribution, or correction.
Unlike slower-moving assets, Bitcoin reacts quickly to shifts in liquidity and sentiment. A single macro headline, regulatory comment, ETF flow update, or geopolitical event can swing price dramatically. This fast reaction forces price to repeatedly probe support and resistance, searching for equilibrium.
Bitcoin also has a highly leveraged derivatives market. When price approaches emotional support, traders pile in with aggressive longs, expecting a bounce. If the bounce doesn’t happen quickly, liquidations can push price lower. That cycle creates frequent tests—sometimes multiple in a week.
Another reason Bitcoin tests these levels is because of market structure. Large players often seek liquidity, and liquidity tends to cluster around major support zones where retail places stop losses. That doesn’t mean “manipulation” in a simplistic sense—it means markets naturally seek zones where orders are concentrated.
Key Indicators That Confirm Emotional Support Is Holding
When Bitcoin enters a major zone, the question isn’t simply “Is this support?” The real question is whether the market is accepting that support. Traders look for confirmation from multiple angles, including volume, volatility, and trend signals. Emotional support holds best when buyers show strength and sellers lose momentum.
Volume is one of the clearest tells. If Bitcoin touches support and volume increases on green candles, it often signals demand stepping in. If volume spikes on red candles and price keeps dropping, it may indicate panic selling and potential breakdown.
Volatility also matters. Emotional support that holds tends to reduce volatility after the first bounce, allowing price to stabilize. If volatility remains high and Bitcoin continues to whip around, it suggests uncertainty and a fragile market.
Trend indicators such as moving averages, RSI, and MACD can also provide clues. A market that is oversold and bouncing from support may be due for a relief rally. But if momentum remains bearish and moving averages act as resistance, support may be at risk.
Volume and Liquidity: The “Battle” at Support
Support zones are arenas where buyers and sellers fight for control. When Bitcoin tests critical emotional support levels, the side with stronger liquidity often wins. If liquidity is thin—common during weekends or low-activity periods—Bitcoin can break support easily due to fewer bids.
Liquidity also impacts how “clean” a bounce looks. A bounce with strong liquidity tends to be orderly, with steady higher lows forming. A bounce with weak liquidity can look like a quick spike that fades fast, trapping late buyers.
Moving Averages as Psychological Anchors
Many traders treat major moving averages like sacred lines. The 200-day moving average, the 50-day moving average, and sometimes the 100-day moving average often become emotional support or resistance because they represent long-term trend health.
When Bitcoin is above these averages, investors feel confident the bull trend is alive. When it falls below, doubt spreads. If Bitcoin tests a major moving average and bounces, it can restore confidence quickly. If it breaks down and stays below, sentiment can shift sharply bearish.
On-Chain Signals: What the Blockchain Reveals About Support
Bitcoin’s unique advantage is transparency. On-chain data provides clues about whether support zones are being defended by long-term holders, short-term traders, or institutions. When Bitcoin tests critical emotional support levels, on-chain metrics can reveal whether the move is driven by panic or strategic accumulation.
One useful concept is realized price, which reflects the average price at which coins last moved. When Bitcoin approaches realized price, long-term holders often view it as value territory. Another key metric is exchange netflows. If Bitcoin moves onto exchanges during a support test, it may signal intent to sell. If coins move off exchanges, it can suggest accumulation and reduced sell pressure.
Also important is the behavior of long-term holders (LTH) versus short-term holders (STH). Emotional support tends to be more resilient when long-term holders remain calm and do not distribute. If long-term holders start selling heavily, support becomes vulnerable.
Long-Term Holders, Whales, and Accumulation Zones
When Bitcoin tests critical emotional support levels, whales often become active. Large holders may accumulate near support because they can absorb selling pressure without chasing price higher. This can create hidden strength beneath the surface.
However, whale activity can also increase volatility. A single large move can trigger fear, especially if it breaks a psychological threshold. That’s why monitoring whale-related signals—like large transfers or shifts in liquidity—can help interpret whether support is likely to hold.
Exchange Reserves and Sell Pressure
If Bitcoin exchange reserves rise during a support test, it often means more coins are available to sell. That can weaken emotional support because it increases supply pressure. If reserves decline, it can strengthen support by tightening available supply.
This is why traders often track exchange inflows/outflows alongside price. A support bounce that coincides with decreasing reserves is generally healthier than a bounce that occurs while reserves surge.
Market Sentiment: Fear, Greed, and the Emotional Swing
Bitcoin doesn’t move purely on fundamentals. It moves on narrative, belief, and crowd emotion. Sentiment indicators such as the Crypto Fear & Greed Index, social media trends, funding rates, and options positioning can explain why Bitcoin tests critical emotional support levels so dramatically.
When fear is extreme, emotional support becomes more meaningful because sellers may already be exhausted. At that stage, even small buying pressure can spark a rebound. But if fear rises alongside increasing sell volume, it can signal a deeper breakdown.
Funding rates are another emotional signal. When funding is heavily negative, shorts dominate and a short squeeze becomes possible. When funding is heavily positive, longs dominate and a flush lower can occur. Support levels often become battlegrounds where these imbalances get reset.
Derivatives and Liquidations: Fuel for Volatility
Bitcoin’s leveraged environment amplifies every support test. If Bitcoin drops into emotional support, many traders try to “catch the bottom” using leverage. If price continues to fall, those leveraged longs get liquidated, pushing price lower and triggering more liquidations.
This is why emotional support tests can become violent. A level may hold in spot markets, but derivatives liquidations can temporarily drive price below it. Often, the key is whether Bitcoin can reclaim the level quickly after a liquidity sweep.
Macro Factors That Influence Support Tests
Bitcoin is increasingly tied to global liquidity and macro trends. Interest rates, inflation expectations, stock market performance, and the strength of the US dollar can all influence whether Bitcoin support holds. When global liquidity expands, Bitcoin tends to perform well. When liquidity tightens, risk assets often struggle.
This is why Bitcoin emotional support levels sometimes fail even if on-chain data looks bullish. Macro pressure can overwhelm crypto-specific narratives. Conversely, macro relief—such as easing financial conditions—can ignite strong rebounds from support.
Institutional involvement also matters. ETFs and institutional allocations can create structural demand, helping defend support zones. But if risk-off sentiment spreads broadly, institutions may reduce exposure, adding selling pressure.
What Happens Next When Bitcoin Tests Emotional Support?
No one can predict Bitcoin’s next move with certainty, but we can outline logical scenarios based on market structure, sentiment, and confirmation signals. When Bitcoin tests critical emotional support levels, outcomes typically fall into three patterns: a strong rebound, a prolonged consolidation, or a breakdown that triggers deeper downside.
A strong rebound usually occurs when support aligns with oversold momentum and buyers step in aggressively. This often leads to a sharp relief rally and short covering. Consolidation occurs when buyers defend support but lack momentum, leading to sideways trading and gradual sentiment recovery. Breakdown occurs when support fails with high volume, triggering liquidations and panic selling.
The most important clue is not the initial bounce, but what happens afterward. A healthy bounce tends to create higher lows and reclaim key moving averages. A weak bounce tends to fade quickly and retest support again.
Scenario 1: Support Holds and Bitcoin Reclaims Momentum
If Bitcoin holds emotional support and begins forming higher lows, it can rebuild market confidence. Traders who sold may re-enter, shorts may cover, and Bitcoin can push into resistance zones. This scenario tends to create a sentiment shift from fear to cautious optimism.
Scenario 2: Sideways Chop and Emotional Reset
Sometimes Bitcoin tests support and simply moves sideways. This frustrates both bulls and bears, reducing leverage and calming volatility. Over time, this can create a stronger base, making the support zone more reliable for the next push upward.
Scenario 3: Support Breaks and Capitulation Begins
If Bitcoin breaks emotional support decisively, it can trigger capitulation. This is when panic selling accelerates and price seeks the next major demand zone. Capitulation can be painful, but it often creates long-term opportunity by flushing weak hands.
How Traders and Investors Can Approach Emotional Support Levels Wisely
The best approach to emotional support levels is discipline. Markets punish emotional decision-making, especially when the term itself highlights psychology. Traders should avoid blindly buying every dip or panic-selling every breakdown. Instead, they can watch for confirmation through volume, trend shifts, and on-chain signals.
Risk management becomes critical. Emotional support is not guaranteed support. Bitcoin can wick below levels, reclaim them, or break down entirely. Long-term investors often use support zones to scale into positions gradually, reducing the risk of mistiming entries. Short-term traders may focus on clear invalidation points and avoid over-leveraging.
The key is to respect uncertainty. When Bitcoin tests emotional support, the market is telling you it’s at a decision point. The goal isn’t to predict perfectly—it’s to respond intelligently.
Conclusion
When Bitcoin tests critical emotional support levels, it’s not just price action—it’s collective belief being challenged. These levels matter because humans attach meaning to them. They represent pain, opportunity, fear, hope, and memory. Understanding emotional support means understanding how Bitcoin traders think, react, and reposition.
Support zones can create powerful rebounds when buyers defend them with conviction, especially when on-chain data shows accumulation and sentiment reaches extremes. But they can also break when liquidity dries up, leverage becomes unstable, or macro forces turn against risk assets. The best strategy is to combine technical analysis, on-chain signals, and sentiment indicators while keeping risk management at the center.
Bitcoin will continue to test emotional support levels because volatility is built into its identity. The investors who thrive are the ones who stay calm when the market becomes emotional—and who recognize that these moments often define the next major trend.
FAQs
Q: What does it mean when Bitcoin tests emotional support levels?
It means Bitcoin is trading near a psychologically important price zone where many traders expect buying demand. These levels often influence sentiment and volatility.
Q: Are emotional support levels the same as technical support?
Not exactly. Technical support is based on chart structure, while emotional support includes psychological factors like round numbers, crowd beliefs, and market memory.
Q: Which indicators help confirm Bitcoin support is holding?
Volume trends, moving averages, RSI, volatility patterns, and on-chain metrics like exchange flows and realized price can help confirm whether support is strengthening or weakening.
Q: Why does Bitcoin often dip below support and then recover?
Because liquidity and stop-loss clustering can cause “support sweeps.” Price may temporarily dip to trigger stops and liquidations before reclaiming the level if demand remains strong.
Q: How should beginners trade Bitcoin around key support levels?
Beginners should avoid over-leveraging, wait for confirmation signals, use clear risk limits, and consider gradual position sizing rather than trying to catch exact bottoms.