

Bitcoin is famous for explosive rallies, but it’s just as capable of sharp, sentiment-shifting pullbacks. When the market transitions from trending to fragile, the Bitcoin price can begin to carve a structure that quietly favors downside continuation. That’s where the idea of a “bearish structure” becomes important. A bearish structure is not a prediction carved in stone. It’s a framework that describes how price is behaving relative to key levels, how liquidity is positioned, and how market participants are reacting to rallies and dips.
Right now, many traders focus on two downside magnets that stand out on higher timeframes: $92,550 as a first destination and $82,000 as a deeper follow-through level. These are not random numbers. They tend to appear where prior demand may have formed, where untested liquidity often sits, or where technical tools like support and resistance, Fibonacci retracement, and structural swing points cluster. If the Bitcoin price remains trapped beneath key resistance zones and continues printing lower highs, the path of least resistance can tilt bearish—especially if momentum and volume confirm the shift.
This article breaks down the bearish structure that could guide the Bitcoin price toward $92,550 and then $82,000, without hype or over-optimization. You’ll learn how bearish structure is identified, why certain levels act like magnets, what indicators can confirm or invalidate the scenario, and how to think about risk in a market that can reverse fast. This is educational content, not financial advice, and it’s designed to help you read the chart more clearly and stay grounded when narratives get loud.
What “Bearish Structure” Means for Bitcoin Price
A bearish structure usually forms when the Bitcoin price begins making lower highs and struggles to reclaim prior support after it breaks. In simple terms, buyers can still push the market up in bursts, but each rally tops out earlier than the last. Meanwhile, sellers defend key zones more aggressively, and breakdown levels start acting as resistance. This is how markets transition from “buy the dip” to “sell the rally,” sometimes without the crowd noticing until the move is already underway.
The most useful way to view structure is to track swing points on a timeframe that matches your strategy. On higher timeframes, bearish structure becomes more meaningful because it reflects broader positioning, not just short-term noise. When the Bitcoin price loses a major pivot and fails to reclaim it quickly, it can signal distribution or at least a shift in control. That doesn’t guarantee a crash, but it increases the probability that downside targets get tested before the trend stabilizes again.
The Difference Between a Pullback and a True Breakdown
Not every dip is bearish. A healthy pullback often happens within an uptrend where the Bitcoin price remains above key trend supports and quickly attracts demand. A true breakdown tends to look different. The market loses a well-watched level, rebounds weakly, and then rolls over again. Over time, that creates a staircase lower, which is why lower highs are such a core concept.
A breakdown also tends to change trader behavior. Instead of bidding aggressively, buyers become cautious and wait for deeper discounts. Sellers gain confidence and start pressing rallies. If that behavior persists, the Bitcoin price can slide into a zone where liquidity is thicker and where long-term buyers finally re-engage.
Why $92,550 Matters as a First Downside Target
When analysts highlight $92,550, it’s often because it sits in a region where price previously interacted with heavy interest. Markets remember. Even if you don’t believe in “magic levels,” you can’t ignore the fact that many participants anchor decisions around the same zones. The Bitcoin price is especially sensitive to these areas because of round-number psychology, derivatives positioning, and the way stop orders tend to cluster around obvious thresholds.
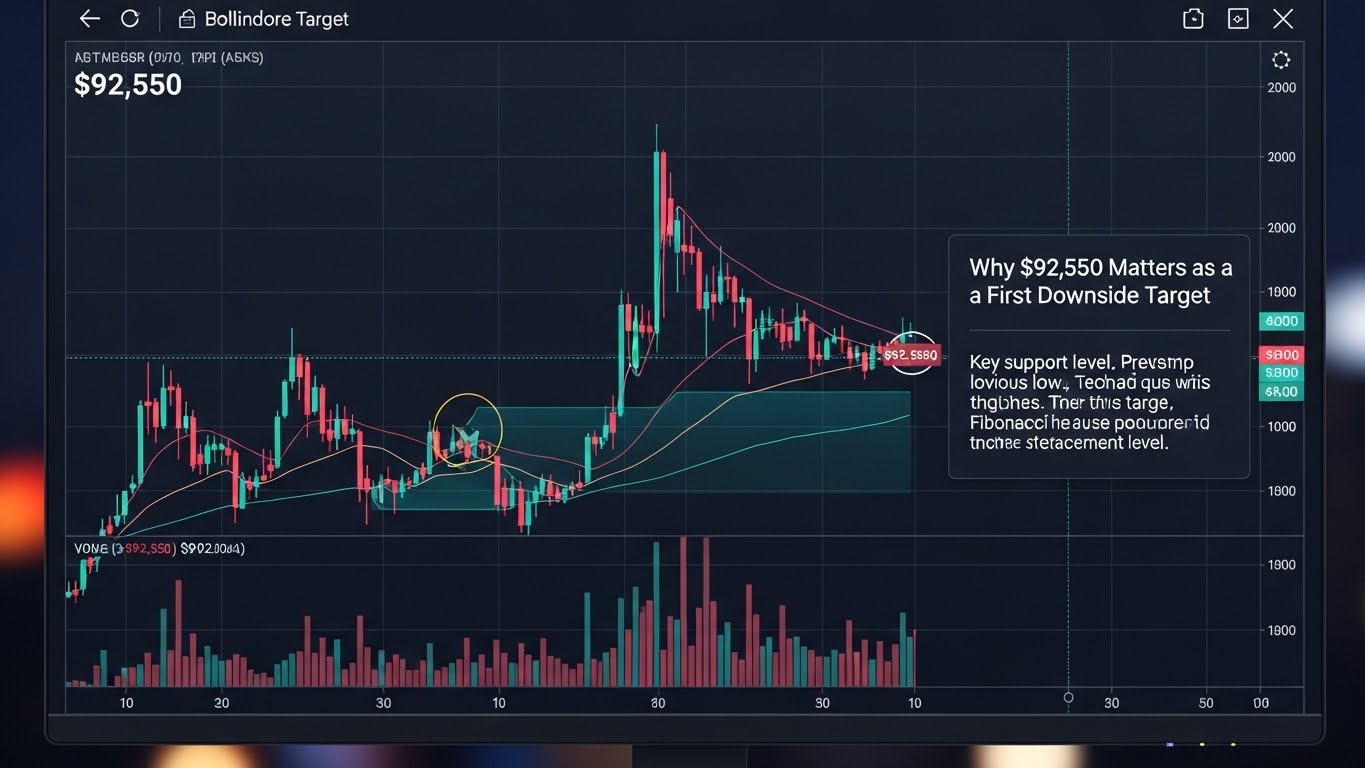
$92,550 can act as a first downside target for several technical reasons. It may align with a prior consolidation shelf, a midpoint of a larger range, or a retracement zone that traders monitor using Fibonacci retracement. It can also represent a “first meaningful demand zone” where buyers who missed earlier entries step in. If bearish structure remains intact, the Bitcoin price often gravitates toward these first major support pools before deciding whether to bounce or continue.
How Liquidity and Stops Pull Bitcoin Price Toward Key Levels
One reason the Bitcoin price tends to move decisively once structure turns bearish is liquidity. Markets are not only about value; they’re about finding orders. When a support level breaks, many stop-loss orders sit just below it. That becomes fuel for continuation because those stops turn into market sells. If price then accelerates, it can trigger additional liquidations in leveraged derivatives markets, adding more forced selling.
In that environment, $92,550 can become a logical liquidity destination. If the market is searching for the next area where bids might be dense, it often tests the nearest “clean” zone that hasn’t been revisited. When the Bitcoin price reaches a level like this, you often see a battle: either a sharp bounce as bids absorb selling, or a pause that becomes a bear flag before the next leg down.
What Confirmation Might Look Like Near $92,550
A common mistake is assuming that reaching $92,550 automatically means a reversal. Levels are zones, not guarantees. If the Bitcoin price approaches $92,550 with heavy momentum and rising sell volume, the first reaction could be weak. If it approaches with slowing momentum, declining sell volume, and signs of buyers stepping in, a stronger bounce becomes more plausible.
Confirmation tools can include volume behavior, candle structure on higher timeframes, and whether price can reclaim broken intraday resistance after the initial test. Even then, the market can still choose continuation, which is why the second target—$82,000—matters if $92,550 fails.
Why $82,000 Becomes the Next Magnet if Bearish Structure Holds
If $92,550 breaks cleanly, $82,000 becomes a bigger, more consequential target because it often sits closer to a higher-timeframe “value zone.” The Bitcoin price tends to spend time at areas where long-term participants consider accumulation attractive. If the market shifts into risk-off behavior, those deeper zones can become natural destinations.
$82,000 can also be significant because it may align with a prior major base, a deeper retracement level, or an area with visible historical demand. When the market breaks a first support and fails to bounce convincingly, it often continues until it finds a level where buyers are willing to defend aggressively. In bearish regimes, the Bitcoin price can move faster than expected as late buyers capitulate and leveraged positions unwind.
The Role of Market Sentiment in Reaching $82,000
A move toward $82,000 is not just technical; it’s psychological. If the Bitcoin price drops through intermediate supports, sentiment can flip from optimistic to fearful. That shift can cause spot buyers to hesitate and short sellers to press harder. In crypto, where narratives spread quickly, sentiment changes can amplify moves, especially during volatile sessions.
This is where market sentiment indicators and derivatives metrics become useful. If fear rises sharply and funding rates turn negative, it can signal overcrowded bearish positioning that eventually sets up a bounce. But before that bounce arrives, the Bitcoin price can still tag deeper liquidity zones like $82,000, especially if macro conditions pressure risk assets broadly.
The Technical Signals Behind a Bearish Structure
Bearish structure is not one indicator. It’s a collection of behaviors that reinforce one another. The most reliable signals are usually structural first, momentum second, and indicators last. Indicators can help confirm what structure already suggests, but structure itself is the foundation.
Lower Highs, Failed Reclaims, and Resistance Stacking
The cleanest bearish signal is a sequence of lower highs. Each lower high implies that demand is weaker on rallies. If the Bitcoin price also fails to reclaim a previously broken support level, that adds weight to the bearish case. These “failed reclaims” often trap late buyers who expect an immediate recovery, then are forced to sell when the market rolls over again.
Resistance stacking happens when multiple tools cluster near the same area, such as a horizontal resistance line aligning with a moving average and a retracement level. When the Bitcoin price repeatedly rejects such a zone, it signals that supply is active and confident.
Moving Averages as Dynamic Structure
Many traders watch moving averages like the 50-day and 200-day as dynamic support and resistance. When the Bitcoin price trades below key moving averages and those averages start sloping down, it can confirm that momentum is shifting bearish. The market can still spike above them temporarily, but repeated failures near these averages often reinforce the “sell the rally” regime.
Moving averages matter most when they align with structural levels. A bearish structure becomes more compelling when the Bitcoin price breaks a pivot, retests it from below near a major moving average, and then rejects.
RSI, Momentum, and Divergences That Traders Misread
The RSI is frequently used to spot overbought and oversold conditions, but in trending markets it can stay oversold longer than people expect. A bearish structure can keep the Bitcoin price under pressure even when RSI looks “cheap.” What matters more is whether momentum is improving as price falls, or deteriorating as price rises.
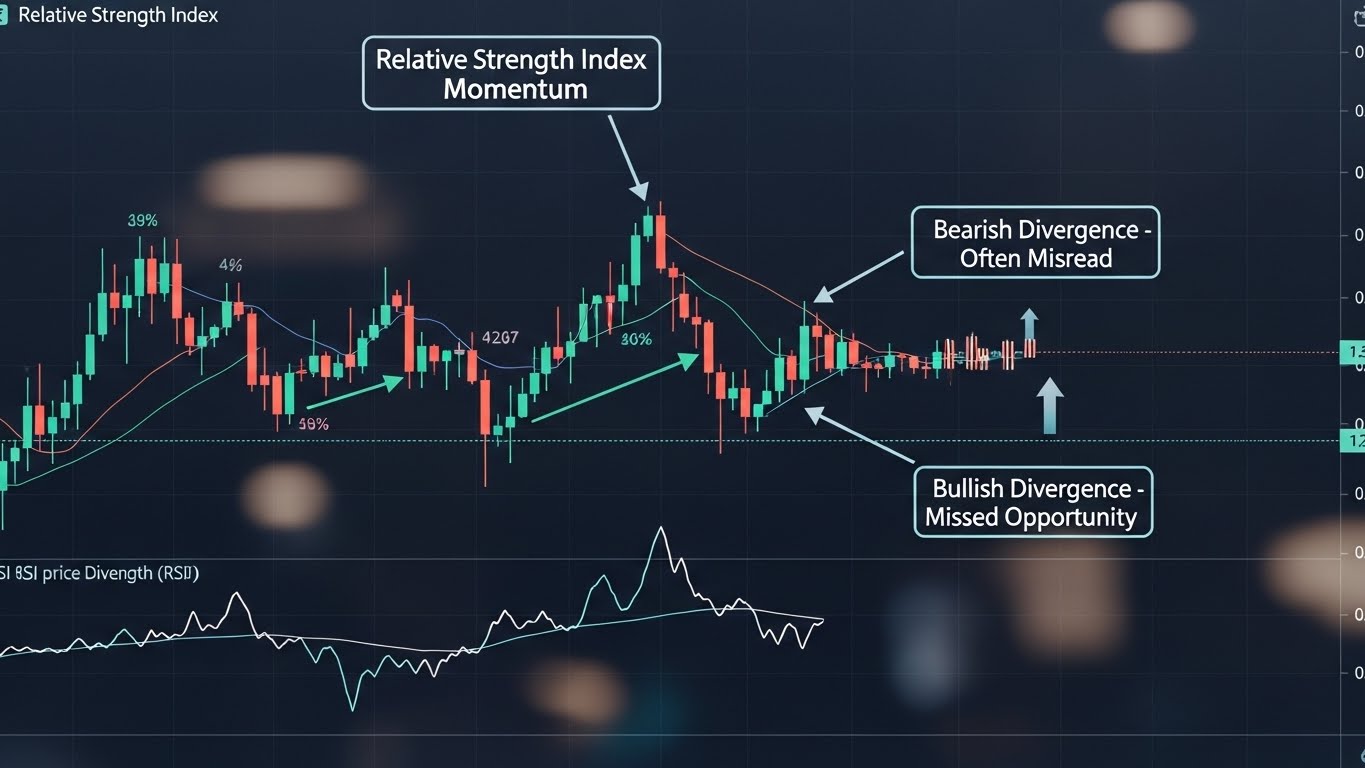
Bullish divergence, where RSI rises while price falls, can hint at weakening downside momentum near a support like $92,550 or $82,000. But divergences are not reversal guarantees. In a strong bearish regime, the Bitcoin price can still make new lows despite divergence, especially if broader liquidity conditions remain tight.
The Macro Backdrop That Can Accelerate Downside
Even the best chart pattern needs context. The Bitcoin price is heavily influenced by macro drivers like interest rate expectations, liquidity conditions, and broad risk appetite. When markets fear tighter conditions, speculative assets tend to struggle. When liquidity improves, Bitcoin often rebounds faster than traditional assets, but it still responds to macro pressure during drawdowns.
If the macro backdrop turns risk-off, bearish structure is more likely to follow through. That doesn’t mean macro alone “causes” the move; it means macro can make it easier for selling to persist.
Liquidity Conditions and Risk Assets
Liquidity is the oxygen of markets. When liquidity is abundant, dips get bought quickly. When liquidity tightens, rallies struggle and sellers become more effective. The Bitcoin price can react sharply to shifts in financial conditions because it’s highly liquid, trades 24/7, and is widely used for leveraged speculation.
If liquidity is draining while the Bitcoin price is already printing lower highs, downside targets like $92,550 and $82,000 become more plausible. Conversely, if liquidity improves, bearish structure can fail quickly, which is why invalidation levels are just as important as targets.
Correlation With Equities and the “Risk-Off” Switch
Bitcoin’s correlation with equities can rise during stress. When the broader market goes risk-off, Bitcoin often feels it. In that environment, a bearish structure can turn into a cascade as cross-asset selling spreads. The Bitcoin price may not need dramatic crypto-specific news to fall; sometimes it simply follows the global tone.
Derivatives and On-Chain Clues That Support the Bearish Case
Beyond charts, crypto offers transparent data that can add depth. Derivatives metrics and on-chain behavior can help confirm whether the bearish structure is driven by real selling or by temporary leverage imbalances.
Open Interest, Funding Rates, and Liquidation Risk
When open interest is high, the market is more fragile. If the Bitcoin price starts dropping while open interest remains elevated, liquidation risk rises. Forced selling can push price faster toward levels like $92,550 and $82,000. If funding rates are positive while price weakens, it can signal that longs are crowded and vulnerable.
If funding turns negative after a sharp drop, it can indicate that shorts are now crowded. That doesn’t automatically mean reversal, but it can set up a squeeze if the Bitcoin price stabilizes and reclaims key levels.
On-Chain Supply Behavior and Holder Conviction
On-chain data can offer clues about whether long-term holders are distributing or holding steady. If long-term holder behavior remains stable while the Bitcoin price drops, it may suggest that the move is driven more by leverage and short-term fear than by long-term selling. That can matter at $92,550 and especially at $82,000, where long-term buyers may be more likely to defend.
However, on-chain metrics should be used carefully. They often lag, and they can be interpreted in multiple ways. The best use is as confirmation, not as a standalone trigger.
How the Bearish Scenario Gets Invalidated
A bearish structure is only valid until it breaks. The simplest invalidation is when the Bitcoin price stops making lower highs and starts reclaiming key levels with strength. If price reclaims a broken support level and holds it on a higher timeframe, the structure can flip from bearish continuation to bullish recovery.
In practical terms, invalidation often looks like this: the Bitcoin price breaks above resistance, consolidates above it, and then uses it as support on a retest. That sequence signals that demand is no longer passive; it’s active and confident. When that happens, downside targets like $92,550 and $82,000 become less relevant, at least in the near term.
Risk Management: How to Think Clearly in a Volatile Market
Because Bitcoin is volatile, the goal is not to be “right,” but to manage risk when you’re wrong. A bearish structure can play out, fail, or partially play out before reversing. That’s why risk management is essential. The Bitcoin price can move hundreds or thousands of dollars in minutes during high volatility. If you’re trading, position sizing and predefined invalidation levels matter more than perfect predictions.
This article is not telling you to short Bitcoin or to expect a guaranteed drop. It’s explaining why the structure could pull the Bitcoin price toward $92,550 and then $82,000 if bearish conditions persist. Treat scenarios as probabilities, not certainties, and always consider that markets can change character quickly.
Conclusion
The bearish structure that targets $92,550 and then $82,000 is built on familiar market mechanics: lower highs, failed reclaims, stacked resistance, and the way liquidity draws the Bitcoin price toward obvious pools of orders. $92,550 can act as a first major destination where demand may attempt to step in. If that level breaks with conviction, $82,000 becomes a deeper magnet where higher-timeframe buyers may engage more aggressively.
Still, structure is not fate. The Bitcoin price can invalidate bearish scenarios by reclaiming key levels and holding them, especially if macro conditions improve and risk appetite returns. The smart approach is to track the structure, watch confirmation signals like volume and momentum, and remain flexible as new data arrives. In Bitcoin, being adaptable is often the edge.
FAQs
Q: Does a bearish structure guarantee Bitcoin price will hit $92,550 and $82,000?
No. A bearish structure increases the probability of downside continuation, but the Bitcoin price can reverse at any point, especially if key levels are reclaimed or macro conditions improve.
Q: Why is $92,550 highlighted as a potential support?
$92,550 often stands out as a structural zone where the Bitcoin price may find prior demand, liquidity, or technical confluence such as a retracement level and historical consolidation.
Q: What would make $82,000 more likely as a target?
If the Bitcoin price breaks below $92,550 and fails to reclaim it quickly, the market may search for deeper liquidity and stronger demand, making $82,000 a logical next zone.
Q: Which indicators help confirm a bearish structure?
Structure is primary, but tools like moving averages, RSI, volume, and derivatives metrics like funding rates and open interest can help confirm whether weakness is persistent.
Q: What’s the safest way to react to bearish scenarios as a beginner?
Focus on education and risk management. Instead of chasing moves, learn key support and resistance zones, watch for confirmation, and avoid over-leveraging because the Bitcoin price can swing sharply.
Also More: Bitcoin Consolidates at $89K as Volatility Hits Lows