

XRP is in a tricky spot. The market isn’t collapsing, but it also isn’t giving bulls an easy win. Price keeps pushing upward, then stalling in the same area again and again. That “same area” is what many traders call the EMA resistance zone—a cluster of exponential moving averages that often acts like a ceiling during weak or uncertain trends.
When XRP struggles below EMA resistance zone levels for days or weeks, it usually means one simple thing: buyers are trying, but they are not strong enough to take control. That doesn’t guarantee a drop, but it does increase the risk of more downside, especially if key supports start cracking.
This question—“more downside?”—matters because XRP has recently shown signs of fragile structure in short-term trading. CoinDesk noted XRP’s move below a key level around $1.93 and framed it as a shift in short-term market structure after repeated failed upside attempts. That kind of behavior often lines up with what an EMA resistance zone is supposed to do: reject rallies until the market proves it has enough momentum to break through.
At the same time, XRP is not just a technical chart. It’s also a narrative-driven asset. The end of major regulatory uncertainty has been a long-running theme, and Reuters reported the SEC ended its lawsuit against Ripple, with Ripple agreeing to a $125 million fine and appeals being dropped. That kind of clarity can support longer-term confidence—but price can still pull back in the short run if the chart structure is weak.
In this article, we’ll explain what it means when XRP struggles below EMA resistance zone levels, why it can lead to more downside, what support zones matter most, and what signals would flip the outlook bullish again. The focus is readability: clear explanations, smooth flow, and practical takeaways—without hype and without over-optimization.
Understanding the EMA Resistance Zone on XRP
An Exponential Moving Average (EMA) is a moving average that reacts faster to recent price changes than a simple moving average. Traders use EMAs to understand trend direction, trend strength, and likely “decision zones” where price either breaks through or gets rejected.
An EMA resistance zone forms when multiple EMAs stack close to each other—commonly the 20-day EMA, 50-day EMA, 100-day EMA, and 200-day EMA—creating a thick band above price. When XRP is below that band, rallies often slow down as price reaches it, because sellers tend to defend that area and buyers hesitate to chase.
This dynamic has been highlighted directly in recent XRP commentary. One report described XRP trading below a cluster of EMAs—an “EMA wall”—with the band sitting roughly in the low-to-mid $2 range depending on the EMA length and timeframe. That’s exactly what an EMA resistance zone looks like: a ceiling built from multiple trend filters.
Why the EMA Zone Matters More Than a Single EMA
A single EMA can be broken easily during normal volatility. But an EMA zone is different because it represents multiple time horizons at once. Short-term traders watch the 20-day. Swing traders watch the 50-day. Longer-term participants care about the 200-day. When they all cluster, it becomes a crowd level.
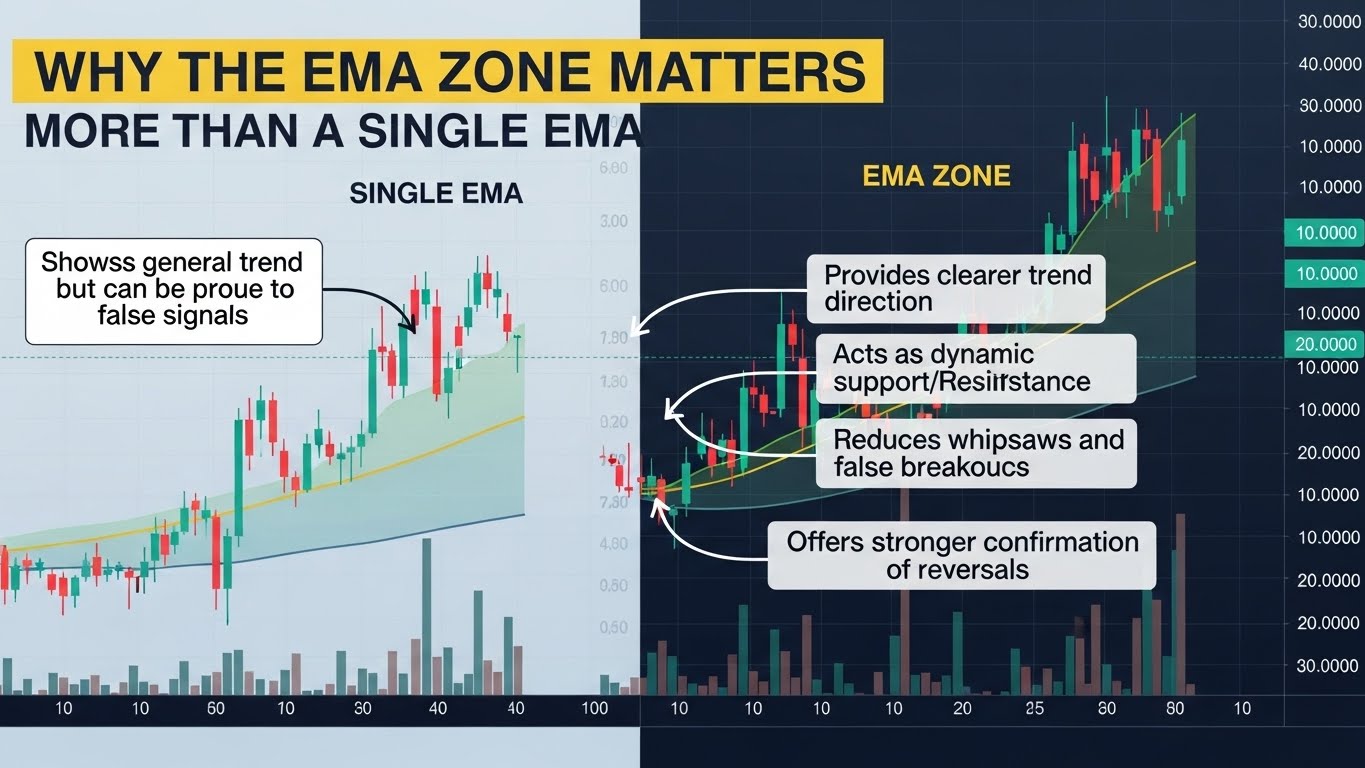
If XRP struggles below EMA resistance zone levels repeatedly, it can signal that the market is stuck in a “sell rallies” mindset. Price might bounce from support, run into the EMA zone, and then fade again. Over time, that behavior can compress XRP into a tighter range—and ranges eventually break.
EMA Resistance and Market Psychology
The psychological part is important. When traders see XRP rejected at the same EMA zone multiple times, they start anticipating rejection. That anticipation creates supply. Sellers place orders earlier. Buyers take profit sooner. Breakouts become harder. This is how bearish momentum builds without a dramatic crash.
The longer XRP spends below the EMA resistance zone, the more meaningful a clean break above it becomes. But until that break happens, the bias often stays cautious.
What “XRP Struggles Below EMA Resistance Zone” Usually Signals
When XRP struggles below EMA resistance zone resistance, the market is often sending a message about trend quality. It usually means XRP is not in a strong uptrend. It may still be bullish on a larger timeframe, but the current phase is either consolidation, distribution, or a corrective pullback.
CoinDesk’s note about XRP falling below $1.93 after multiple failed attempts to sustain momentum captures the same idea: repeated failure above resistance increases vulnerability when support gets tested again.
Lower Highs and Weak Follow-Through
One of the clearest bearish clues is when XRP prints lower highs while staying under the EMA zone. That pattern says each bounce is weaker than the previous one. Even if XRP doesn’t drop immediately, it becomes more likely that the next support test will eventually fail.
A healthy bullish market usually shows stronger follow-through: price breaks resistance, holds it, and then continues. When XRP struggles below EMA resistance zone resistance, the opposite often happens: price breaks nothing important, and rallies get sold.
Why Rejections at EMAs Can Lead to Deeper Pullbacks
EMAs are often used as dynamic support and resistance. In a downtrend, price rallies up to an EMA and then rejects. That rejection can kick off another leg lower. This is why EMA zones matter: they can act like “trend checkpoints.”
Recent XRP coverage has framed the EMA ribbon turning bearish on higher timeframes as a caution signal and suggested that loss of key support could open downside toward lower demand zones. When a bearish EMA ribbon forms, it’s not just a chart decoration—it’s a sign that trend pressure is leaning downward across multiple time horizons.
Key Support Zones to Watch If Downside Continues
When discussing “more downside,” the most useful thing is not fear. It’s structure. Markets move between support and resistance. If XRP can’t reclaim the EMA zone, the next question becomes: where are buyers likely to defend?
Different analysts highlight different numbers, but the idea is consistent: there are specific zones where XRP previously attracted demand, and those zones matter again if price weakens.
CoinDesk’s discussion of a break below $1.93 puts that region on the map as an important short-term structural reference point. Another recent analysis emphasized the importance of the $2 area, warning that losing it could open downside toward roughly the $1.90–$1.82 zone.
Support Is a Zone, Not a Single Number
New traders often treat support like a single line. In reality, support is usually a “band” where bids are spread out. If XRP sells off into a support zone, you may see a bounce, but that bounce can still fail later if the EMA resistance zone continues to reject.
This is why a bounce alone is not enough to flip the trend. For the bearish pressure to ease, XRP usually needs to do two things: defend support convincingly and then reclaim the EMA resistance zone with follow-through.
The Danger of Repeated Support Tests
Support becomes weaker when it gets tested too often. Each test consumes buying interest. If XRP struggles below EMA resistance zone resistance and repeatedly returns to the same support, the odds of a breakdown gradually rise.
That doesn’t mean breakdown is guaranteed. It simply means risk increases over time unless buyers prove they can push XRP above the EMA cluster.
The Role of Volume and Momentum in Confirming More Downside
Price is the headline, but volume and momentum are the evidence. If XRP is weak but volume is fading, it can signal sellers are running out of energy. If XRP is weak and sell volume expands, it can signal real distribution.
Why Volume Matters at the EMA Resistance Zone
When XRP tests the EMA resistance zone, pay attention to what happens on volume. If XRP pushes into the zone with strong volume and still gets rejected, that can be bearish, because it shows even heavy buying couldn’t break resistance. If XRP pushes into the zone with weak volume, rejection can simply mean buyers weren’t committed.
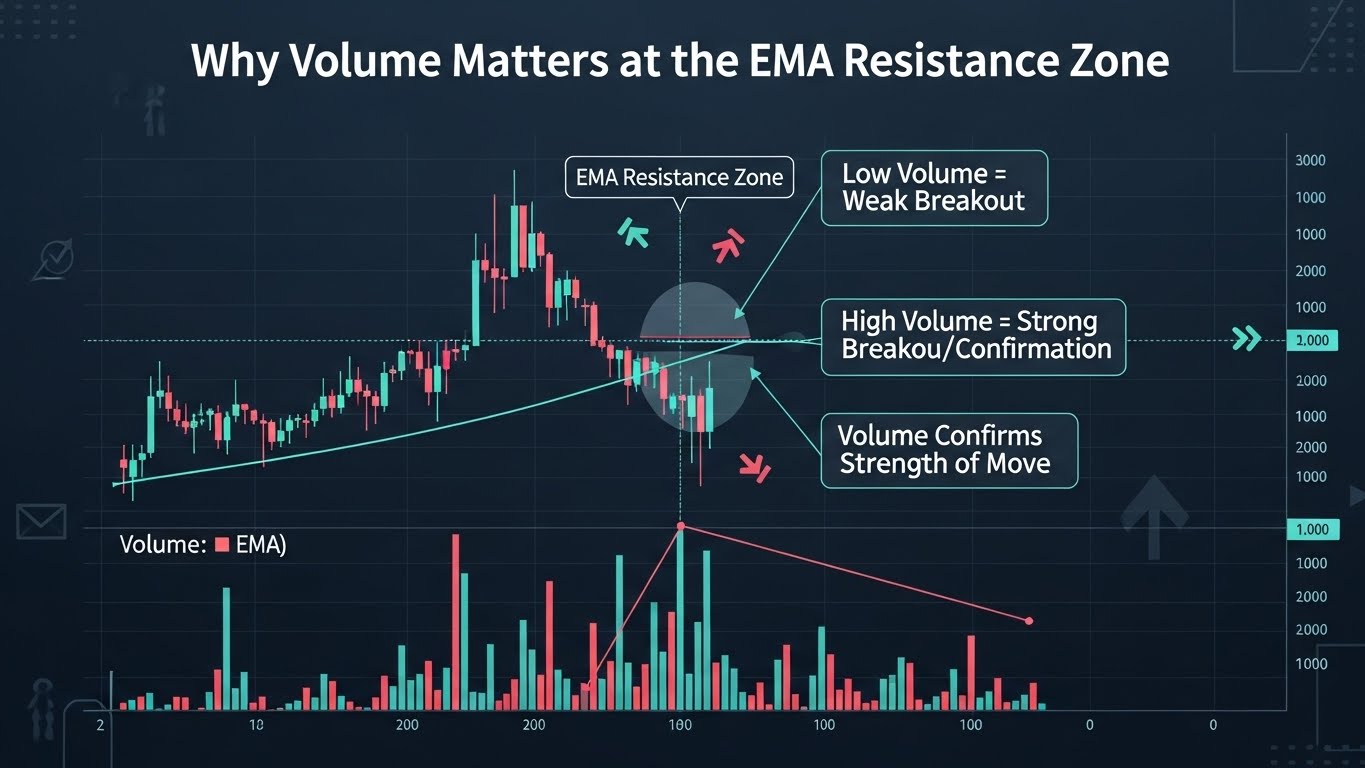
A clean bullish shift usually happens when XRP breaks above the EMA zone and volume rises as it holds above. Without that, the market often stays in chop—or slides lower.
RSI and “Oversold” Traps
The RSI is popular because it’s simple. But RSI can also mislead people in trending markets. XRP can stay “oversold” longer than expected if downside momentum is strong.
Some recent commentary highlighted RSI reaching levels seen in earlier periods that preceded a major rally, suggesting traders watch RSI for potential mean reversion signals. That can be useful context, but it’s not a guarantee. RSI is best used as confirmation near support, not as a reason to ignore structure.
If XRP struggles below EMA resistance zone resistance and RSI bounces while price continues to print lower highs, that can still be bearish. The key is whether RSI improvement is paired with a structural reclaim of resistance.
What Would Turn XRP Bullish Again?
A bearish article should still explain the bullish invalidation clearly. Markets flip fast, and XRP is fully capable of reversing hard if conditions change.
If XRP struggles below EMA resistance zone resistance, the most important bullish signal is a break and hold above the EMA cluster. Not a quick wick. Not a short-lived spike. A hold.
Recent XRP technical coverage has specifically described the “EMA wall” as a cluster that XRP needs to reclaim to restore bullish momentum. That frames the core invalidation neatly: if XRP gets above the wall and stays there, the bearish structure weakens.
The Reclaim-and-Retest Pattern
The cleanest bullish reversal pattern is reclaim and retest. XRP breaks above the EMA zone, then pulls back and uses the zone as support. This shifts the market’s behavior from “sell rallies” to “buy dips.”
That’s when downside risk usually drops sharply, because sellers lose their best defensive area.
Why False Breakouts Are Common Around EMA Clusters
EMA clusters attract attention, and attention attracts traps. XRP can break above briefly, trigger breakout buyers, then fall back under the zone. That is why you want confirmation: daily closes, follow-through, and retest behavior.
If XRP keeps failing above the EMA zone, that failure itself becomes bearish evidence.
Macro and Narrative Factors That Can Amplify the Move
XRP is more sensitive than many assets to narrative flow—especially regulatory and institutional headlines. One reason is that XRP’s history has been closely tied to U.S. regulatory developments.
Reuters reported the SEC ended its lawsuit against Ripple, and summarized the outcome, including the fine and the dropped appeals. That kind of clarity can be supportive long term, but price can still move based on short-term positioning, liquidity, and broader crypto sentiment.
Regulatory Clarity Helps, But It Doesn’t Eliminate Pullbacks
Even when fundamentals improve, charts can still correct. The market can “sell the news.” Traders can rotate capital. Bitcoin can pull the entire market lower. XRP can still be rejected at EMA resistance even with good headlines.
So the right way to treat narrative is as an amplifier, not a guarantee. If XRP breaks above the EMA zone, positive narrative can help fuel continuation. If XRP fails at the EMA zone, even positive narrative may not stop a pullback.
Broader Market Liquidity Still Matters
Altcoins generally perform best when liquidity is flowing and the market is risk-on. When liquidity tightens, traders reduce risk, and weaker charts get punished first. If XRP struggles below EMA resistance zone levels during a risk-off environment, the downside scenario becomes more believable.
A Simple, Readable Scenario Map for XRP
Here’s the clean way to think about it, without overcomplication.
If XRP struggles below EMA resistance zone resistance and cannot reclaim it, the market will keep focusing on nearby support zones. A loss of key support can open the door to a deeper move into lower demand bands, as some recent XRP analyses have suggested around the $1.90–$1.82 region if major levels fail.
If XRP breaks above the EMA zone and holds, downside risk decreases and the market can shift toward upside targets and trend continuation.
The job is not to “guess.” The job is to watch which side proves itself.
Conclusion
XRP struggles below EMA resistance zone levels for a reason: the market is not yet willing to pay higher prices with confidence. An EMA cluster acts like a ceiling, and repeated rejections can keep pressure on XRP until either support breaks or buyers finally reclaim the zone.
If XRP continues to fail at the EMA resistance zone, more downside remains possible—especially if key supports get tested repeatedly or break. Recent market commentary has pointed to fragile short-term structure after XRP slipped below a key level near $1.93, reinforcing why traders are watching support closely. Another analysis flagged a bearish EMA ribbon dynamic and warned that losing major support could open downside toward lower demand zones.
Still, bearish is not permanent. The market can flip quickly. A strong break above the EMA resistance zone, followed by a hold and retest, is the clean signal that the trend is improving. Until then, the cautious approach is to respect the EMA wall, respect support levels, and let the chart confirm the next direction.
FAQs
Q: What does “XRP struggles below EMA resistance zone” mean?
It means XRP is trading under a cluster of exponential moving averages, and rallies into that zone are getting rejected, which often signals weak trend momentum.
Q: Does EMA resistance guarantee XRP will drop?
No. EMA resistance increases downside risk, but XRP can still consolidate and later break above the zone. Confirmation comes from closes above the EMA cluster and successful retests.
Q: Which EMA is most important for XRP right now?
Traders commonly watch the 20-day EMA and 50-day EMA for short-to-mid trend direction, and the 200-day EMA for long-term trend context. The “zone” matters most when several EMAs cluster together.
Q: What’s the clearest bullish signal if XRP is below the EMA zone?
A clean bullish signal is a breakout above the EMA resistance zone with follow-through, ideally a daily close above and a retest that holds as support.
Q: How does Ripple’s regulatory situation affect XRP’s price action?
Regulatory clarity can improve long-term confidence, and Reuters reported the SEC ended its lawsuit against Ripple with appeals dropped. But XRP can still pull back short term if technical structure remains bearish.
See More: XRP Hits Resistance at $2.00 What’s Next for Investors?