

A wave of selling pressure has washed across the crypto market, leaving even the strongest names—Bitcoin (BTC), Ethereum (ETH), and Ripple (XRP)—fighting to hold crucial support. When markets wobble, investors look for a grounded price prediction that blends technical and fundamental insights, rather than noise or hype. This in-depth analysis explores the structure of the current downtrend, the signals flashing on widely used indicators like RSI and MACD, and the catalysts that could flip momentum from bearish to bullish. We’ll walk through realistic support and resistance levels, examine liquidity pockets and order book depth, and consider how macro events, on-chain activity, and derivatives positioning may influence volatility.
The goal is not to guess a magic number. It’s to map scenarios—bull, base, and bear—that respect market structure and the behavior of market makers, whale accumulation, and retail flows. Whether you trade short-term swings or allocate for the long run, use this analysis as a framework to refine risk management, time entries, and protect capital. As always, crypto is volatile, and no price prediction is guaranteed. Treat this as research, not financial advice.
Market overview: risk tone, liquidity, and trend strength
The broader crypto market has been rotating from momentum-chasing highs into a defensive posture. That shift shows up in three places: first, the trend structure on daily charts where lower highs are forming beneath declining moving averages; second, in on-chain metrics that show cautious net exchange flows; and third, in derivatives where funding rates and open interest reflect fading long conviction. The combination has tightened liquidity around key levels, increasing the odds of stop-run wicks and mean-reversion bounces that can whipsaw traders without changing the primary trend.
A practical approach is to identify the high-volume nodes on the volume profile and mark out supply zones where sellers repeatedly step in. In parallel, follow macro triggers—such as interest-rate guidance, dollar strength, and risk-asset sentiment—that can accelerate or stall crypto momentum. With that context, let’s break down the price prediction landscape for BTC, ETH, and XRP.
Bitcoin (BTC) price prediction guarding the trendline
Structure and momentum
Bitcoin remains the market bellwether, and its chart typically leads sentiment across altcoins. Recent sessions show BTC slipping below a short-term ascending trendline, testing the next support near prior consolidation. The Relative Strength Index (RSI) has cooled into neutral territory, signaling neither capitulation nor a runaway rally. Meanwhile, the MACD histogram has been printing smaller negative bars, hinting that downside momentum may be losing some steam even as sellers retain the upper hand.

The 200-day moving average (a magnet for mid-term trend watchers) looms as a pivot. Holding above it preserves a constructive bias; losing it convincingly opens a path to sweep deeper liquidity. Volume on red days has expanded during selloffs and tapered on green reliefs, a classic bearish tell showing sellers are more aggressive at the market than buyers.
Key levels and scenarios
The first support and resistance pair to watch centers on a former breakout shelf, often backed by robust high-volume nodes. If BTC defends that shelf and pushes back over the nearest supply zone, a quick mean-reversion into the mid-range is feasible. Failure there invites a liquidity grab lower, where aggressive short covering can spark sharp but short-lived rallies.
Bull case: A daily close back above the declining short-term moving average with follow-through and rising volume would suggest accumulation. On that path, BTC can retest overhead resistance at the last breakdown point. If funding rates stay balanced and open interest rebuilds without crowding, a stair-step climb toward the range high becomes plausible, though sellers will likely fade strength at each prior swing high.
Base case: A choppy range develops as BTC oscillates between support and the first resistance band. This is the “price discovery” zone where market participants negotiate fair value after a selloff. Watch for sweep-and-reclaim patterns around lows: when price dips below a known swing low, runs stop, and immediately reclaims the level on rising volume, it often precedes a push to the range midpoint.
Bear case: A decisive breakdown below the range floor, coupled with rising negative delta and heavy spot selling into thin order books, would expose the next weekly demand zone. In this scenario, longs step aside until a bullish divergence on RSI or a higher low confirms stabilization.
Catalysts to watch
Macro is still in the driver’s seat. A softer inflation print or dovish rhetoric can buoy risk assets and crypto beta, while a hawkish turn or sudden risk-off in equities can pressure BTC. On-chain, monitor whale wallet accumulation, stablecoin flows, and exchange reserves. In derivatives, keep an eye on liquidation heatmaps—clusters of levered positions often define where price “hunts” next. A reset of overleveraged longs can clear the path for a more sustainable grind higher.
Ethereum (ETH) price prediction waiting for confirmation above key resistance
Structure and relative performance
Ethereum has underperformed on select risk-on days and outperformed on some drawdowns, reflecting its dual identity as both a macro-sensitive asset and a platform token shaped by network usage. The ETH chart shows a stubborn supply zone capping rallies, with each approach met by seller absorption visible in the order book. The RSI has been range-bound, and MACD crossovers have lacked follow-through—classic signs of indecision while the market weighs gas costs, L2 activity, and rotating narratives.
ETH’s relationship to BTC is critical. If the ETH/BTC pair starts printing higher lows and breaks a local downtrend line, capital can rotate into Ethereum-led setups. Conversely, if BTC dominates, ETH’s upside typically lags until broader confidence returns. DeFi TVL, staking flows, and net issuance post-merge remain powerful LSI keywords for long-term investors because they shape the fundamental supply-demand balance, even if technicals drive short-term priceals.
Key levels and scenarios
ETH’s first battleground lies at a cluster of prior daily highs—the resistance band where sellers previously overwhelmed buyers. Clearing it on substantial spot volume can flip the narrative from fade-the-rally to buy-the-dip, at least within the current range.
Bull case: ETH flips that resistance into support, holds above it for several sessions, and builds a series of higher lows. That structure shift allows a measured price prediction toward the next resistance confluence, often where a higher timeframe moving average meets a prior breakdown origin. Participation from perp markets without runaway positive funding is ideal, as it suggests genuine spot demand rather than fragile leverage.
Base case: The market continues to coil, respecting support at the mid-range and rejecting at first resistance. This chop favors patient traders who buy deviation-and-reclaim patterns near the lows and scale out into the range midpoint. Momentum remains muted until a catalyst unlocks the trend.
Bear case: A failure to hold the current floor, especially on expanding volume, risks an air pocket lower into the next weekly demand. Watch for ETH to overshoot those levels intraday and spring back—deviation is standard when liquidity thins and stops clustering below obvious levels.
Catalysts to watch
On-chain drivers for ETH include trends in L2 throughput, restaking dynamics, and validator share. Increasing active addresses, sticky staking participation, and healthy DeFi activity form a long-term constructive backdrop. In the near term, the macro calendar, risk appetite in equities, and BTC’s path remain decisive.
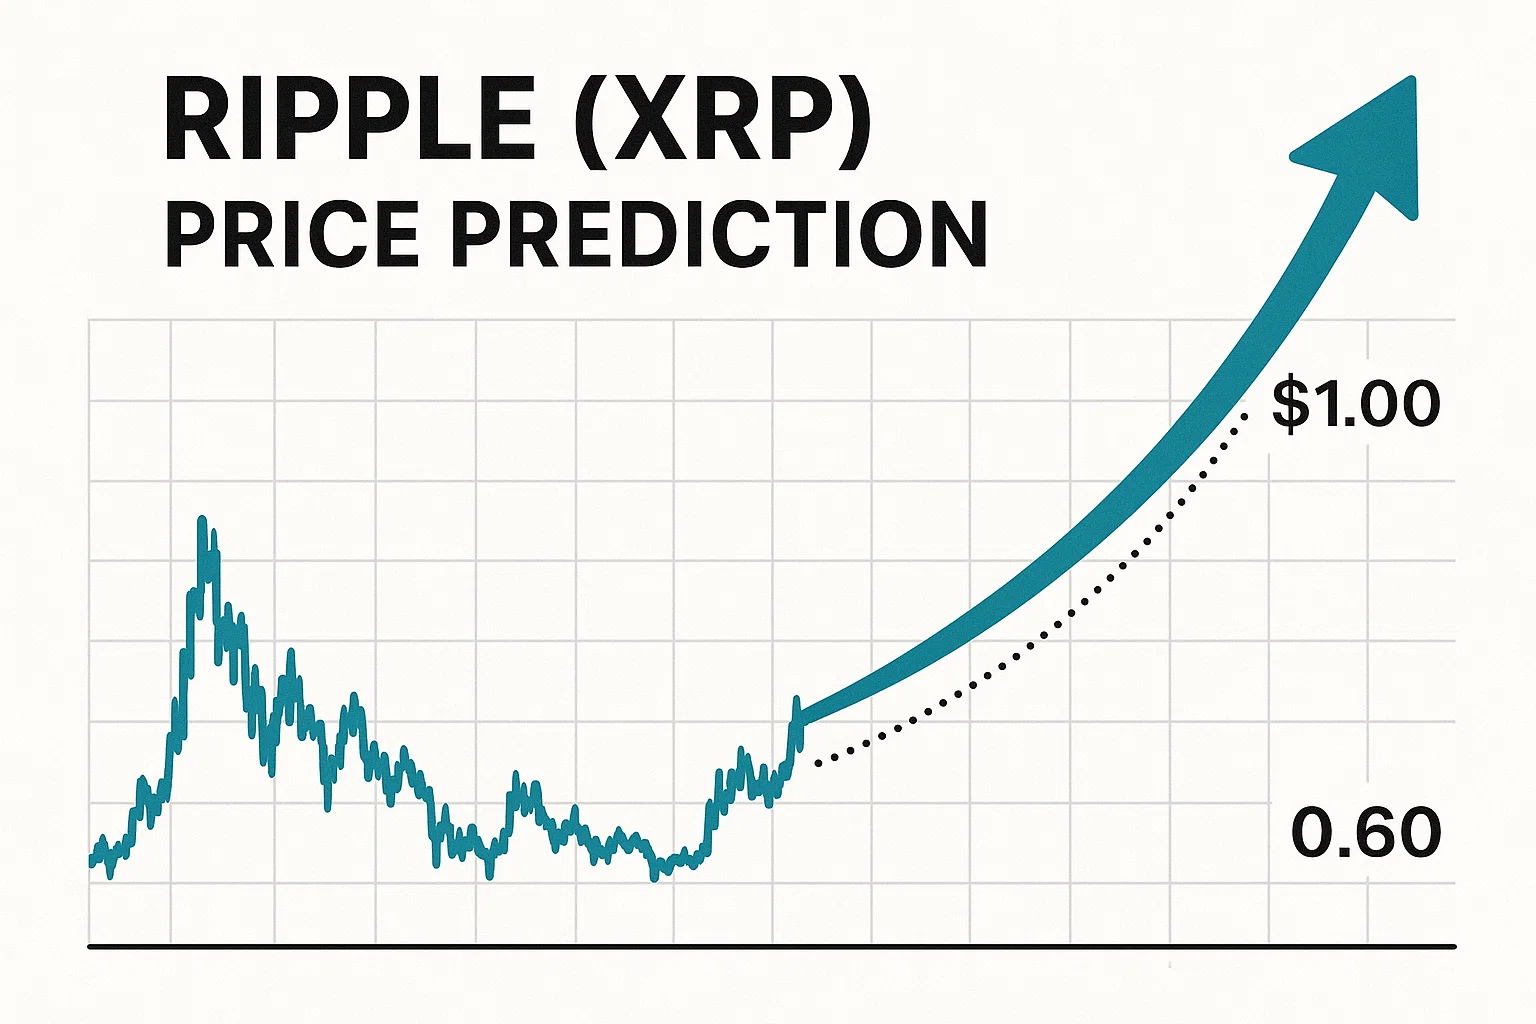
Ripple (XRP) price prediction navigating headlines and horizontal ranges
Structure and sentiment
Ripple (XRP) trades as a story-driven asset layered over a technical horizontal range. The chart often shows clean support and resistance bands where price pings between well-defined levels. That behavior makes liquidity sweeps frequent, with wicks beyond the range that quickly reverse once stop orders are filled. The RSI floats near neutral but occasionally prints bullish or bearish divergences, giving tactical clues for range edges.
Order flow reveals that rallies into the top of the range meet supply from bagholders seeking to exit, while dips close to the bottom bring in bargain hunters and whale bids. The MACD’s slow turns reflect this mean-reverting quality, with momentum building only when news jolts expectations.
Key levels and scenarios
XRP’s roadmap is a lesson in patience and level respect. A clean break and daily close above multi-touch resistance could unleash a squeeze through thin upside liquidity, especially if shorts are crowded. Conversely, a failure to hold the range floor could invite a stop cascade into the next historical support.
Bull case: A convincing breakout above the range high, validated by high spot volume and sustained acceptance on retests, enables a price prediction targeting the measured move of the range height added to the breakout level. Momentum confirmation via rising OBV and stable funding would support trend continuation rather than a one-off spike.
Base case: Sideways churn persists. Traders fade extremes, waiting for deviation patterns and quick mean-reversion scalps. This scenario continues until a catalyst—be it macro, legal clarity, or a liquidity shock—pushes XRP to “choose a side.”
Bear case: A decisive loss of the range floor, followed by acceptance below it and failure to reclaim, opens a slide toward the next demand pocket. Watch for capitulation signatures like capitulatory volume spikes, extreme negative funding, and sentiment washouts; those often mark trend pauses.
Catalysts to watch
For XRP, headline sensitivity is high. Regulatory clarity, ecosystem partnerships, and cross-border payments progress can all alter sentiment quickly. In parallel, broader crypto liquidity and Bitcoin dominance will shape how aggressively XRP can trend once a breakout gets underway.
Technical indicators that matter right now
RSI and divergences
The Relative Strength Index remains one of the most practical tools for spotting shifts beneath the surface. In all three assets—BTC, ETH, and XRP—look for bullish divergence when price makes a lower low but RSI prints a higher low. That setup frequently precedes relief rallies, especially when it happens near the confluence of a trendline, a moving average, and a high-volume support zone. Conversely, bearish divergence at range highs warns that rallies may fade if participation thins.
MACD momentum turns
The MACD clarifies trend health by comparing faster and slower EMAs and visualizing momentum via the histogram. During sustained downtrends, early crosses often fail; stronger signals appear when the histogram builds a series of higher lows even as price grinds sideways. This subtle shift indicates sellers are running out of fuel, laying groundwork for a base. Use MACD in conjunction with volume and candle structure—never in isolation.
Volume, OBV, and liquidity maps
Volume validates moves. A breakout or breakdown without volume expansion is a red flag. On-Balance Volume (OBV) can confirm accumulation or distribution over time. Meanwhile, liquidity heatmaps and liquidation clusters identify where price is statistically attracted during volatility. Price often seeks out areas of concentrated stops before reversing; recognizing those magnets improves timing and risk placement.
Fundamental and macro crosswinds
Dollar, yields, and risk appetite
Crypto’s risk profile means it responds strongly to the U.S. dollar and bond yields. A firmer dollar and rising real yields tend to pressure crypto; a softer dollar and easing yields generally support risk. Watch how equities behave around major economic prints. If stocks reject key resistance and turn lower on heavy volume, the crypto market typically follows.
On-chain flows and exchange reserves.
For BTC and ETH, exchange reserve trends offer a slow-burn signal. Declining reserves suggest coins are moving to cold storage—potentially bullish over time. Rising reserves imply more supply ready to sell. For XRP, network activity and ecosystem adoption carry weight, though liquidity context remains pivotal.
Derivatives positioning funding, OI, and skew
Funding rates that lean too positive indicate crowded longs; too negative hints at fear—and potential for a short squeeze. Open interest (OI) spikes without corresponding spot inflows can foreshadow liquidation cascades. Options skew and implied volatility help map likely ranges, with steep skew revealing asymmetric hedging demand.
Risk management and execution
Position sizing and invalidation
In volatile phases, position sizing and clear invalidation levels matter more than the exact entry price. Place stops where your trade thesis is objectively wrong, not where you’re merely uncomfortable. If you buy a support reclaim, your stop belongs below the reclaim level that defines the setup, not at an arbitrary round number. Allow room for wicky liquidity hunt,s but avoid moving stops deeper into losses.
Scaling and patience
Scale in on confirmation. For example, if BTC reclaims a broken level and holds on a retest with improving delta, consider adding rather than front-running the reclaim. The same principle helps on ETH and XRP: reward the market for proving your thesis. If it doesn’t, step aside quickly and reassess.
Avoiding common pitfalls
Many traders confuse a bounce with a trend reversal. The difference is acceptance and follow-through. A reversal requires structural change—higher highs and higher lows on the timeframe you trade—and improving breadth across correlated assets. Respect the higher timeframe trend even when lower timeframes offer tempting counter-trend moves.
Synthesized outlook where BTC, ETH, and XRP could go next
Bitcoin price prediction: BTC’s next decisive move hinges on its reaction at the 200-day moving average and the nearest supply zone. A reclaim and hold above that band would unlock a measured drift toward the range midpoint, with a chance to test the breakdown origin if volume supports. Failure invites one more liquidity sweep into weekly demand before any durable base can form. Short-term traders should focus on sweep-and-reclaim behavior; longer-term investors can use weakness to DCA with strict risk parameters.
Ethereum price prediction: ETH needs confirmation via a clean flip of first resistance into support. Do that with rising spot volume, and ETH can outpace BTC for a leg as rotation flows in. If resistance holds and BTC wobbles, ETH likely remains range-bound, creating opportunities at the edges rather than in the middle.
Ripple price prediction: XRP’s playbook is breakout-or-range. Acceptance above the range high would target the measured move of the range, especially if shorts are trapped. Absent a catalyst, expect continued oscillation with frequent liquidity hunts. Traders should wait for either a decisive reclaim or a breakdown acceptance before committing size. Across all three, selling pressure defines the backdrop, but the market is one catalyst away from a character change. Let the chart confirm it.
Conclusion
When selling pressure mounts, the most brilliant move is not to predict a single path but to craft price prediction scenarios grounded in structure, momentum, and flows. Bitcoin (BTC) sets the tone around its key moving averages and supply zones. Ethereum (ETH) seeks a resistance flip to reclaim leadership, and Ripple (XRP) awaits a catalyst to resolve its horizontal range.
By prioritizing support and resistance, monitoring RSI, MACD, and OBV, and respecting liquidity dynamics in the order book, you can navigate volatility without overreacting to every headline. Keep position sizes sensible, define invalidation, and let the market prove your thesis before you size up. Nothing here is financial advice—just a structured lens to evaluate risk and opportunity in a fast-moving market. Trade the levels, not the emotions, and update your plan as new information arrives.
FAQs
Q: Is now a good time to buy BTC, ETH, or XRP?
It depends on your timeframe and risk tolerance. In a sell-pressure environment, short-term trades work best near clearly defined support after a sweep-and-reclaim. At the same time, longer-term investors may prefer gradual accumulation on dips with strict invalidation levels. Always size positions so a single trade cannot materially damage your account.
Q: Which indicators are most reliable during choppy markets?
Focus on RSI divergences, MACD momentum shifts, and volume confirmation. Pair them with support/resistance mapping and volume profile levels. Indicators should support a thesis built on structure; they are not signals in isolation.
Q: What macro events affect crypto prices the most right now?
Inflation readings, central bank guidance on interest rates, and global risk appetite drive beta across risk assets. A stronger dollar and rising real yields often pressure crypto, while a softer dollar and dovish tones can ease selling pressure and support a bid.
Q: How do I avoid getting trapped in fake breakouts?
Require confirmation. Look for break-and-hold above resistance with rising spot volume and acceptance on retests. If a breakout instantly fails back into the range, step aside—failed moves often travel to the opposite side of the range.
Q: Should I use leverage in this environment?
Leverage amplifies both gains and losses. With liquidity hunts common, overleveraged positions get liquidated quickly. If you use leverage at all, keep it low, define tight invalidations, and prefer confirmed setups rather than anticipatory entries.
Also More: Ethereum Price Breakout 2025: Key Levels & Targets Analysis